
The most important decision for top management is where the money goes. Capital allocation not only...

The Capital Logic: Navigating Internal Investment Decisions - Part 1 of 2
June 10, 2025

A Framework for Internal Capital Allocation by FP&A Leaders
Business leaders often struggle when deciding how to invest capital — whether to grow sales, support operations, or expand capacity. These decisions are rarely straightforward due to multiple strategic alternatives, constraints, and considerations. "At its root, investment analysis is a process of examining alternatives and deciding which alternative is most preferable."
This article introduces a framework tailored for Financial Planning and Analysis (FP&A) leaders to assess whether to nurture, transform or exit a business. It focuses on allocation of internal capital — resources already within the company — rather than acquiring external assets or businesses. Part I lays out the core components of the framework and highlights their essential principles, financial tools, and actions. Part II explains how decisions flow across product, product line, and corporate levels.
Understanding Organic Investment Decisions
Investment decisions are made constantly across organisations: extending a product line (e.g., Star Wars Lego sets), upgrading existing offerings (e.g., Samsung smartphones), pivoting product development (e.g., Slack's shift from gaming to messaging), discontinuing outdated services (e.g., Netflix ending the DVD mailing service), or reallocating funds to new priorities (e.g., divestments to focus on AI). Even operational items within an operating budget qualify as investments if they are made to generate future value rather than to maintain the status quo.
For FP&A professionals, the first priority is to understand what business the firm is in and the strategic context in which it operates. Analytical tools such as PESTEL, SWOT, and the BCG matrix help make these decisions. Broadly, internal investment choices fall into three categories (see Figure 1):
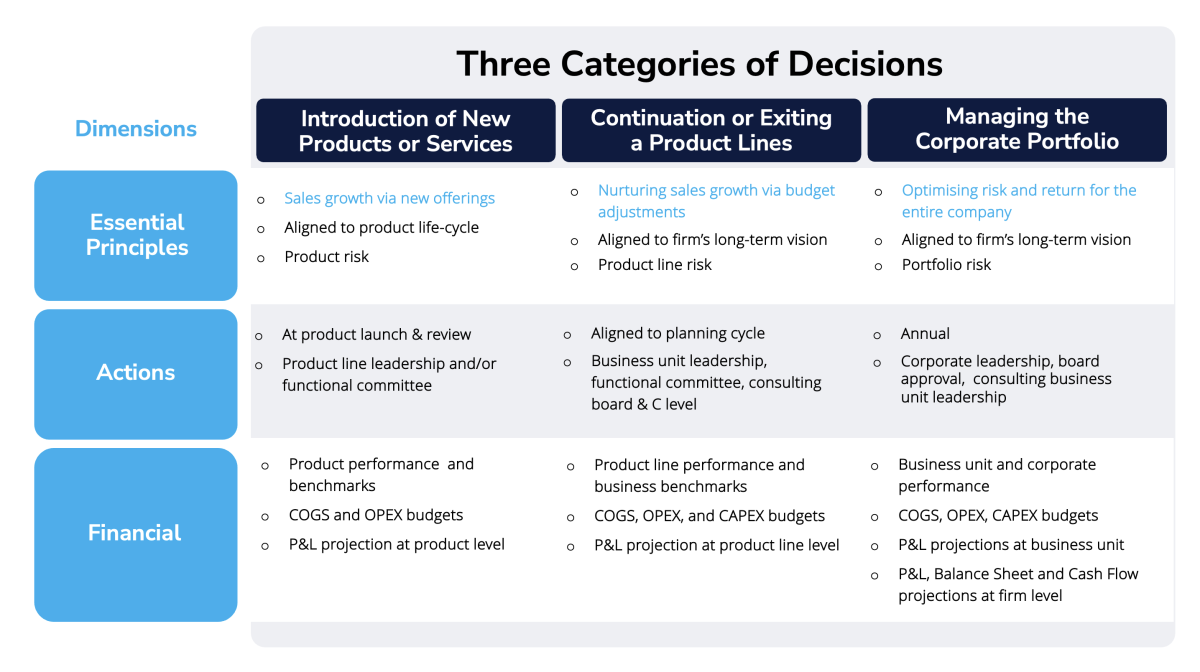
Figure 1. A Framework for Internal Investment Decisions for FP&A Leadership
1. Introduction of New Products or Services
When launching a new product or service, the goal is usually to achieve product-market fit and mass adoption . Early decisions focus on whether a large enough addressable market exists and whether it is possible to pivot upon customer feedback. Not only firms must prioritise human, intellectual, and financial capital, but also prospective customers must be persuaded to pay.
Investments at this stage span:
- Product Development, covering all efforts from idea to launch. Expenses may be capitalised and amortised over time, affecting profitability and cash flow in early periods.
- Go-To-Market (GTM) efforts, including establishing sales channels and customer awareness.
- Manufacturing and Operations, delivering capacity and requiring property, plant, and equipment (PPE) investments.
Finally, time horizons tend to vary with the length of the product life cycle, from a few months (e.g., fast fashion clothing) to many years (e.g., heavy equipment).
Leaders should be clear about what they are trying to achieve — technology validation, launching a minimum viable product (MVP), market penetration, scaling into adjacent markets, etc. — and select the right metrics to target: MOIC (ROI), NPV, IRR, payback time, and unit economics.
Financial models relying on discounted cash flow (DFC) should use unlevered free cash flows (UFCF) at the project's cost of capital, with terminal value assumptions once they reach the steady state. Additional assumptions about the context, grouped by scenarios of consistent conditions, serve as levers to explore possible outcomes in a sensitivity analysis. Lastly, the returns should exceed hurdle rates set by corporate leadership to account for product risk and guide go/no-go decisions. Hurdle values for speculative ventures, as in technology products, tend to be much higher than those of less risky offerings.
New product investments are also real options: they allow flexibility to defer, expand, or exit depending on how the market responds. It means that introducing a new offering is often a reversible decision. Revisiting decisions at established milestones after launching an offering not only facilitates oversight but also protects the firm from mishandling capital.
To handle this complexity, FP&A teams should clarify project goals, break down execution into phases, and model scenarios. Procedurally, FP&A decision-makers can follow a sequence of check-points such as Feasibility → Business Case → Commitments → Commercialisation → Product Review → Product Retirement (Figure 2). Successful product introductions pass all these gates (strategically, operationally, and financially).
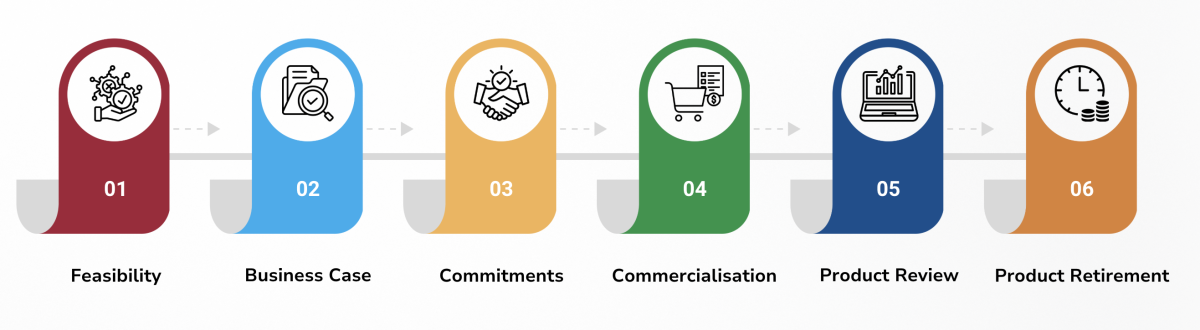
Figure 2. Six Milestone Gates of Product Investment
2. Continuation or Exiting Product Lines
The cumulative impact of decisions at the product level shapes entire product lines. Often, leaders are tempted to extend product lines based on a single success, but ongoing investments should be evaluated just as rigorously as new initiatives.
Unlike initial launches, continuation decisions are often embedded in annual operating plans. It is helpful to track each product line as a distinct project, and each product individually, and apply the same metrics used for new offerings. Finally, differentiating between maintenance expenditures and true investments during budgetary exercises offers better oversight.
Decisions are still reversible or changeable at the product line level, but are more difficult to make than early-stage pivots. Since the reviews happen during Quarterly Business Reviews (QBR) and Operating Planning, FP&A often relies on variance analysis — referencing prior expectations and history — to track contribution margin, discounting, GTM incentives, and costs. Performance also focuses on IRR, projected market share, unit economics, and logo acquisition.
When returns or risks are not tolerable, the decision to exit a product line or kill an offering may include divesting assets, which can yield higher returns than acquisitions. If an entire business unit is sold, the Mergers & Acquisitions (M&A) team typically leads the process.
3. Managing the Corporate Portfolio
At the highest level, companies aim to optimise capital allocation across business units, balancing new investments and ongoing expenditures and ensuring the portfolio as a whole performs well. Each unit is assessed as a standalone entity, even in firms with integrated operations or segment reporting.
Unique risks of individual business units, and for that matter, of particular product lines and products in an R&D portfolio, are reduced by the diversification of the total portfolio . Key metrics include MOIC, IRR, contribution margin, sales and margin growth, and their corresponding share of the entire firm. These metrics are compared to industry benchmarks and used to steer capital to the highest-return businesses.
Mature firms may disrupt competitors by launching new products. It introduces complexity and a resource prioritisation challenge, with resources spread thinly and risking mediocre outcomes. Cash and capital structure involving equity and debt become critical at this level. Decisions should then consider the firm's leverage (debt capacity), Levered Free Cash Flows (LFCF), Return On Invested Capital (ROIC), Return On Equity (ROE), and capital expenditures as a share of free cash flow.
Despite these tools, capital allocation at the corporate level is often suboptimal. Changes usually occur only during annual planning or after in-depth unit evaluations.
Conclusion
Investment decisions are cross-functional and core to a firm's future. Financial models alone aren't enough; strategy, operations, and market insights matter just as much. Success also requires organisational discipline, scenario thinking, and milestone-based governance.
FP&A leaders can provide clarity, impose discipline, and strengthen capital allocation by structuring decisions across product, product line, and corporate levels. The framework presented in this article sets the stage for better decisions — ones that align risk and return, short-term execution, and long-term strategy.
In the next part of the article series, we will discuss how to apply the framework with clarity, discipline, and flow.
Acronyms
PV = Present Value = The current value of a future stream of cash flows.
DCF = Discounted Cash Flow = A financial valuation method used to estimate the value of an investment based on its expected future cash flows, adjusted for the time value of money.
UFCF = Unlevered Free Cash Flow = EBITDA – CAPEX – working capital – taxes
LFCF = Levered Free Cash Flow = EBITDA – CAPEX – working capital – taxes – debt payments
NPV = Net Present Value = A financial metric that calculates the difference between the present value of cash inflows and outflows over a specific period.
MOIC = Multiples of Invested Capital = (Current Valuation + Amounts Returned) / Total Investable Capital.
At the product or product line level, ROI = PV(EBIT) / PV(OPEX+CAPEX) of investments with terminal values. While ROI measures the percentage increase or decrease in an investment relative to its cost, MOIC provides a multiple of how much the investment has returned over the initial amount.
IRR = The discount rate at which the NPV of an investment equals 0.
ROE = Net Income (annual) / Shareholders' Equity.
ROIC = Net Operating Profit After Tax (NOPAT) / Invested Capital. ROIC presents the returns on all capital, including debt and equity, reflecting only operating performance and excluding financing costs.
Sources:
- Luenberger, D. (1998). Investment Science. Oxford University Press.
- Stanke, B. (2025, January 4). A comprehensive guide to strategic planning models — helping companies deliver more value through better process management | Bob Stanke. BOB STANKE. https://www.bobstanke.com/blog/strategic-planning-models
- Moore, G. A., & McKenna, R. (1991). Crossing the chasm. http://ci.nii.ac.jp/ncid/BA75140322
- Capital Budgeting: Capital Budgeting Decisions: Balancing Hurdle Rates for Long term Success - FasterCapital. (n.d.). FasterCapital. https://fastercapital.com/content/Capital-Budgeting--Capital-Budgeting-Decisions--Balancing-Hurdle-Rates-for-Long-term-Success.html
- Dubner, T., Sarma-Rupavtarm, R., & KPMG. (2022). CFOs have the opportunity to dispel corporate value-creation mythology and embrace fresh valuation insights. https://kpmg.com/kpmg-us/content/dam/kpmg/pdf/2022/putting-the-active-in-active-portfolio-management.pdf
- Boer, F. P. (1999b). The valuation of technology: Business and Financial Issues in R&D. John Wiley & Sons.
- Moore, G. A. (2015). Zone to Win: Organizing to Compete in an Age of Disruption. Diversion Books.
The full text is available for registered users. Please register to view the rest of the article.
Related articles

In this article, the author speculates on the evolution of capital planning and outlines how this...

On March 25, 2021, about 550 FP&A practitioners from 70 countries around the globe gathered to...

CEOs that are more strategically oriented and less numbers-oriented tend to want to partner with a...

In this article, the author outlines how the five essential FP&A team roles can contribute to...

In his latest video, CFO at Noatum Maritime, Joao Almeida, shares his recipe for success in...
+
Subscribe to
FP&A Trends Digest
We will regularly update you on the latest trends and developments in FP&A. Take the opportunity to have articles written by finance thought leaders delivered directly to your inbox; watch compelling webinars; connect with like-minded professionals; and become a part of our global community.