
This article presents a practical framework for FP&A leaders to drive disciplined internal capital allocation decisions...

The Capital Logic: Navigating Internal Investment Decisions - Part 2 of 2
June 12, 2025

Applying the Framework: Decision Flow Across Investment Levels
In the first part of this series, we introduced a structured framework for FP&A professionals to evaluate internal capital allocation — whether to nurture, transform, or exit parts of a business. We explored decision-making at three levels: product, product line, and corporate.
Part II now assembles these elements into a coherent, sequential flow of decisions, showing how choices at one level influence and are influenced by others. While investment analysis is both an art and a science, applying structured logic can bring greater efficiency, consistency, and impact.
From Strategy to Execution: A Loop, not a Line
Investment decisions rarely happen in a strict top-down or bottom-up sequence. Instead, they often begin with corporate-level intent, for example, a plan to enter a new space or refresh a product line. This intent typically materialises as a single product investment, setting off a chain of more specific decisions, as seen in Part I of this article series.
Think of the organisation as a set of nested dolls: The outer shell is the firm, containing business units, each containing product lines, which in turn consist of individual offerings.
One can analyse decisions either from the outside-in (top-down strategy) or inside-out (bottom-up innovation). Either way, the distinctions between levels matter: they vary in scope, decision-makers, types of risk, required capital, and impact on diversification. The decision flow is, in fact, a loop (see Figure 1).
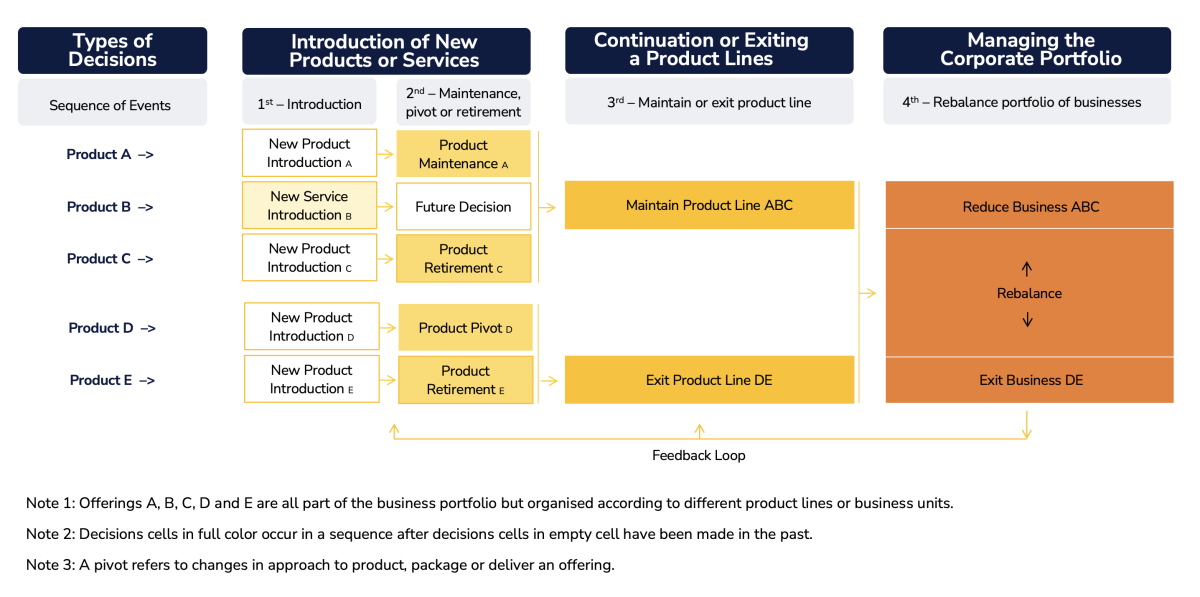
Figure 1. Internal Investment Decisions Analysed by FP&A Leadership
This layered view helps leaders apply the right capital budgeting principles and recognise interdependencies. Unlike financial asset portfolios, where positions can be easily rebalanced, internal investments often involve commitments, organisational inertia, and long-term bets.
Within this framework, capital can be categorised by accounting treatment:
- COGS: Direct product-related costs, such as manufacturing and delivery.
- OPEX: Ongoing operations, marketing, and support.
- CAPEX: Long-term infrastructure, factories, intellectual property, or R&D platform investments.
The framework's flow ensures discipline and sequencing by eliminating distractions, aligning decision metrics with scope and risk, and clarifying the risk-reward balance when making capital commitments. The layers of decisions and their loop can be seen in the case of Apple's Vision Pro (here, here, and here) and GM's Chevy Bolt (here, here, and here). For the former, after a long commitment, it faced a vanishing market, which led to duly disinvestment. For the latter, a similar dynamic was followed by consumer outcry, which led it to relaunch an updated product.
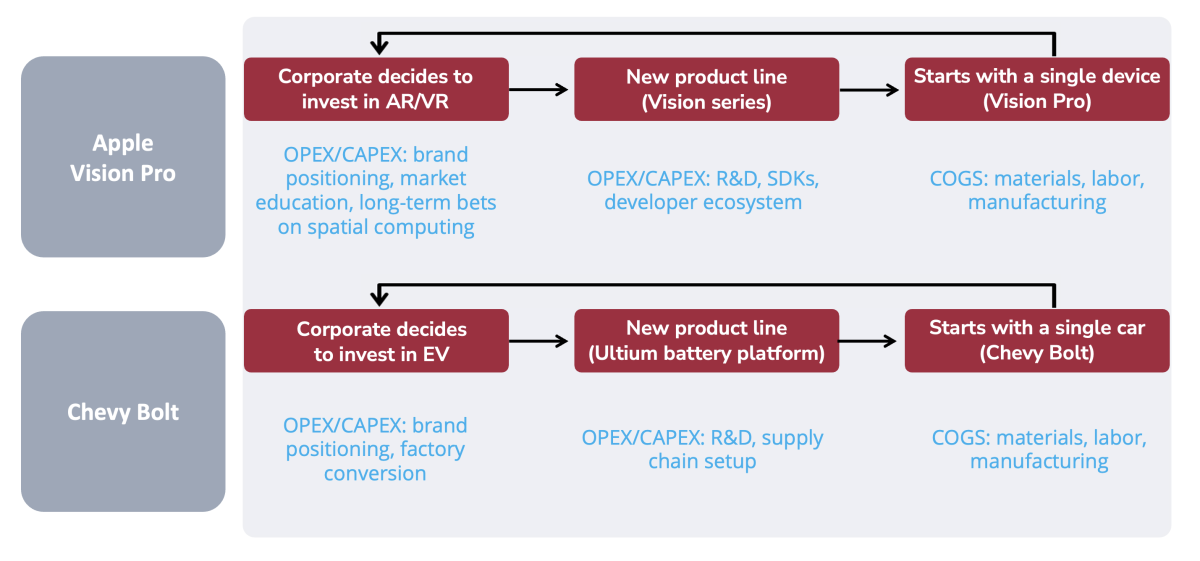
Figure 2. Examples of Hierarchical Investment Layers and Loop
Key FP&A Considerations and Best Practices
Drawing on both field experience and best practices, the following insights support the effective application of this framework:
1. Investment Risk Varies with Scope, Maturity, and Diversification
The life cycle stage of a firm impacts its investing and valuation practices. Discount rates and hurdle rates should reflect the stage and scope of investment:
- High for early-stage prototypes or market experiments,
- Moderate for product lines with some market validation,
- Lower for well-diversified corporate portfolios.
As diversification increases, unique risk declines, and required returns can be adjusted downward. An established business with somewhat successful products can use discount rates equal to its cost of capital. FP&A should help decision-makers calibrate these rates, translating technical, commercial, or operational risk into financial terms.
2. Financial Models Must Be Context-Sensitive
From a DCF financial modelling perspective, cash flow assumptions, especially terminal value, time horizon, the hurdle rate (typically the cost of capital plus a changing risk premium), and the externalities involved (e.g., tariffs) are essential.
Just as important is strategic alignment: Is this an incremental investment or a brand-new one? Does it come with real options to expand, wait, exit, or pivot? Is it an irreversible decision?
3. Beware of a Bloated Product Portfolio
Launching too many products can strain resources and dilute focus. Many firms (e.g., HP, Cisco, and VMware, as experienced by the author) expanded product lines during growth periods, only to discover low returns from most offerings. In contrast, firms like Spotify concentrate on a few high-performing products, as young firms do.
Key success factors include strong governance of new offerings, periodic review of in-market products, and aggressive decommissioning of old offerings. FP&A should encourage portfolio discipline to avoid accumulating "zombie" products that drain cash and attention.
4. Preserve Flexibility for Unexpected Opportunities
Seizing sudden market opportunities, like the pandemic-driven shift to remote work, requires flexibility. Zoom finally captured the video conferencing market by being readier than WEBEX, Microsoft Teams, and others.
FP&A can enable flexible budgets and agile governance by keeping a fraction of the OPEX or R&D budget unallocated for opportunistic "bets", saving it if no significant opportunity arises. It can be complemented by terminating unsuccessful investments early . This agility can meaningfully increase economic value, especially when timing matters .
5. Don't Treat Product Line Continuation as Irreversible
Large companies often maintain product lines longer than warranted, whereas smaller firms tend to make exit decisions more often, given their scarcity of capital and fewer stakeholders.
FP&A should challenge assumptions about continuity: Does the offering still generate above-hurdle rate returns? Are opportunity costs being ignored? Could reallocated capital generate higher returns elsewhere? Failure to act on any of these can lead to declines like those seen with Blackberry or Kodak.
6. Use Milestones and Governance, but Avoid Bureaucracy
Incremental decision-making provides flexibility as the risks and opportunities are better assessed over time. A milestone-based approach improves visibility and control through decision-making by setting clear checkpoints, predictable lead times, minimum mandatory documentation, and transparent conditions for go-no-go decisions.
Cross-functional committees made of independent voters and advisors, tailored to the size of the organisation and the complexity of the decisions they review, reduce bias and improve outcomes. However, FP&A leaders should ensure these don't become bureaucracies that slow down execution.
7. Match Hurdle Rates to Scope and Control
Decision-makers at the product level often have limited visibility over indirect costs and a reduced scope of control. Moreover, product-level performance tends to be more volatile than firm-level performance, thereby increasing the impact of unique risks. As a result, hurdle rates should be higher than at the corporate level.
Meanwhile, corporate-level leaders can consider synergies and diversification effects, justifying lower risk premiums. Tailoring financial expectations to scope improves decision quality and reduces the chance of under- or over-investing at any one level.
8. Not All Investments Pay Off Directly — Some Are Enablers
Sometimes, investments do not directly produce profitable outcomes when seen in isolation, but when seen as part of a whole, they enable broader strategic gains. For instance, Amazon's massive investment in AWS infrastructure supports Amazon.com's ecosystem.
FP&A should discern the appropriate scope and avoid penalising a key strategic investment unfairly.
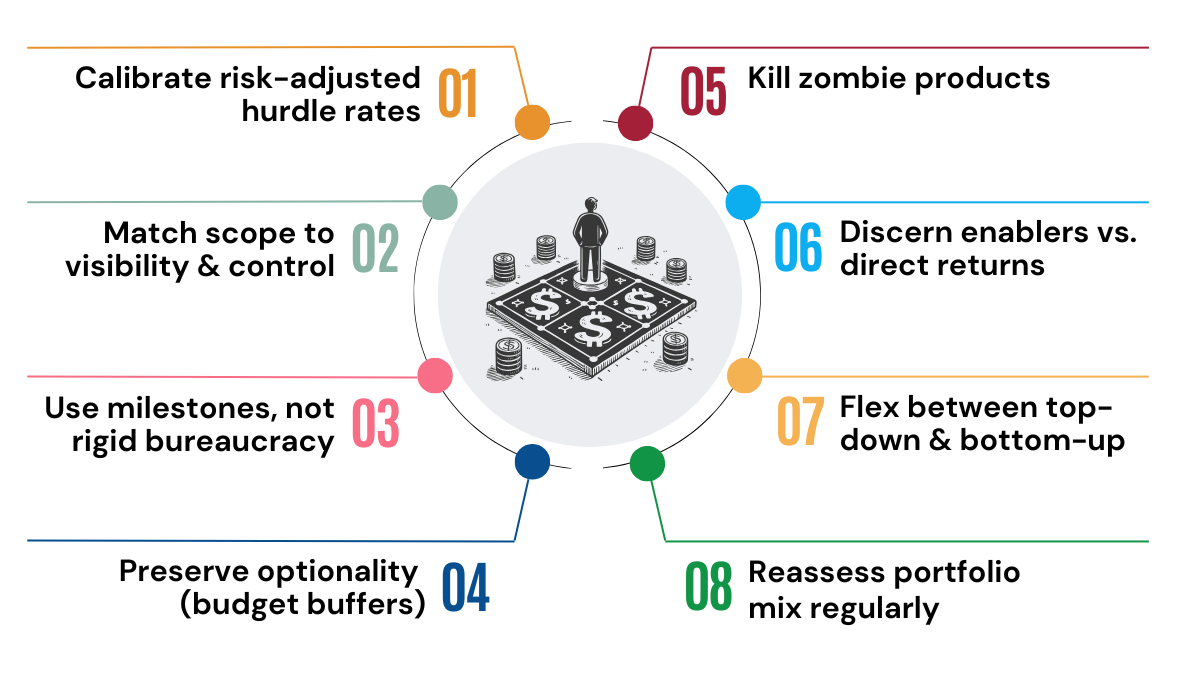
Figure 3. Eight Best Practices for Capital Discipline
Conclusion: An Integrated, Disciplined Approach to Internal Capital Allocation
This three-level framework helps firms navigate the complexity of organic investment decisions. It clarifies the feedback loop from corporate vision to product execution. It also distinguishes between enabling investments (creating future opportunities) and outcome-generating investments (directly driving returns).
By applying consistent tools, adjusting expectations to risk and scope, and fostering a dynamic decision-making culture, FP&A leaders can ensure capital flows to the most value-generating parts of the business.
Acronyms
PV = Present Value = The current value of a future stream of cash flows.
DCF = Discounted Cash Flow = A financial valuation method used to estimate the value of an investment based on its expected future cash flows, adjusted for the time value of money.
UFCF = Unlevered Free Cash Flow = EBITDA – CAPEX – working capital – taxes
LFCF = Levered Free Cash Flow = EBITDA – CAPEX – working capital – taxes – debt payments
NPV = Net Present Value = A financial metric that calculates the difference between the present value of cash inflows and outflows over a specific period.
MOIC = Multiples of Invested Capital = (Current Valuation + Amounts Returned) / Total Investable Capital.
At the product or product line level, ROI = PV(EBIT) / PV(OPEX+CAPEX) of investments with terminal values. While ROI measures the percentage increase or decrease in an investment relative to its cost, MOIC provides a multiple of how much the investment has returned over the initial amount.
IRR = The discount rate at which the NPV of an investment equals 0.
ROE = Net Income (annual) / Shareholders Equity.
ROIC = Net Operating Profit After Tax (NOPAT) / Invested Capital. ROIC presents the returns on all capital, including debt and equity, reflecting only operating performance and excluding financing costs.
Sources:
- Damodaran, A. (2024). The Corporate Life Cycle: Business, Investment, and Management Implications. Penguin.
- There are as many characterizations as authors but generally we see young firms focused on product development, middle age firms commercializing and growing sales, mature firms with stable or stagnant markets, and declining firms with decreasing revenues. See Damodaran, A. (2024) for a useful reference.
- Dixit, A. K., & Pindyck, R. S. (1994). Investment under uncertainty. Princeton university press.
- Boer, F. P. (1999). The valuation of technology : business and financial issues in R&D. In Wiley eBooks. https://ci.nii.ac.jp/ncid/BA42536929
- Amato, B. N. (2022, February 14). Why CFOs should learn to let go. Journal of Accountancy. https://www.journalofaccountancy.com/news/2022/feb/why-cfos-shift-money-productive-investments/
- Mosley, T. (1994). Winning at new products: Accelerating the process from idea to launch (2nd edition) by Robert G. Cooper. Reading, MA: Addison-Wesley Publishing Company, 1993. 358 pages. $16.95. Journal of Product Innovation Management, 11(4), 369–370. https://doi.org/10.1016/0737-6782(94)90105-8
The full text is available for registered users. Please register to view the rest of the article.
Related articles

In this article, the author outlines how the five essential FP&A team roles can contribute to...

The most important decision for top management is where the money goes. Capital allocation not only...

CEOs that are more strategically oriented and less numbers-oriented tend to want to partner with a...

In this article, the author speculates on the evolution of capital planning and outlines how this...

In his latest video, CFO at Noatum Maritime, Joao Almeida, shares his recipe for success in...
+
Subscribe to
FP&A Trends Digest
We will regularly update you on the latest trends and developments in FP&A. Take the opportunity to have articles written by finance thought leaders delivered directly to your inbox; watch compelling webinars; connect with like-minded professionals; and become a part of our global community.