The London FP&A Board met on Tuesday, 23 January 2024, to discuss Mastering FP&A – Predictive Planning and Forecasting. Senior FP&A practitioners from companies such as Unilever, Microsoft, NHS, Genpact, Amazon, BP, British Council, Sony Interactive Entertainment, AkzoNobel, Paramount, JLL and many others attended this event.

Figure 1: London FP&A Board №32, January 2024
The London FP&A Board was hosted in The Engine Room of the iconic Battersea Power Station for the first time.
Larysa Melnychuk, CEO of FP&A Trends Group and Founder of the International FP&A Board, chaired this meeting sponsored by Workday in partnership with Michael Page and International Workplace Group. The event’s agenda spanned from theoretical specification of the concept of Predictive Planning and Forecasting (PPF) to insights into best practices and know-how and sharing of practical day-to-day experiences:
- Evolution and Balance: From Traditional Planning to Predictive Forecasting (PPF)
- Key Elements of the PPF Framework
- Practical insights from the field, presentation by Tanbir Jasimuddin, Director, COO Transformation at DWF
- Roadmap to Implementation: Navigating the PPF Maturity Model
- Group work: Conclusions and Recommendations
1. Evolution and Balance: From Traditional Planning to Predictive Forecasting (PPF)
Over the recent years, the FP&A community has been experiencing a paradigm shift from Traditional to Predictive Forecasting. So, what is Predictive Planning and Forecasting (PPF)?
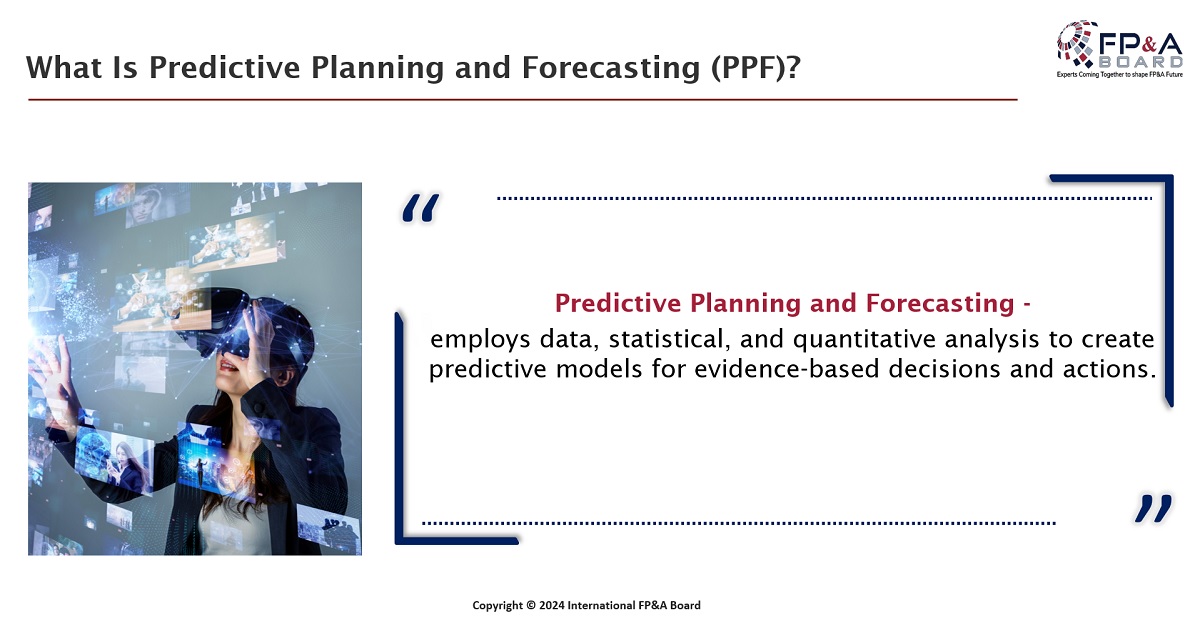
Figure 2
Predictive Planning and Forecasting should be a top priority for modern FP&A departments as it overcomes the weaknesses of traditional planning and helps organisations to become more agile.
What are the key benefits and drawbacks of PPF?
- Accurate Forecasts
- Proactive Decisions
- Efficiency
- Resource Optimisation
- Scenario Analysis
- Enhanced Collaboration
However, for successful PPF, the following drawbacks must be dealt with:
- Data quality
- Resource Intensive
- Complexity
- Model Reliance
- Data Privacy
- Resistance to Change
Eventually, the immediate ability to run prompt scenarios is the measure of successful FP&A agility.
How do Traditional and Predictive Planning & Forecasting (PPF) differ?
The picture below can help you to understand the difference between traditional planning and PPF.
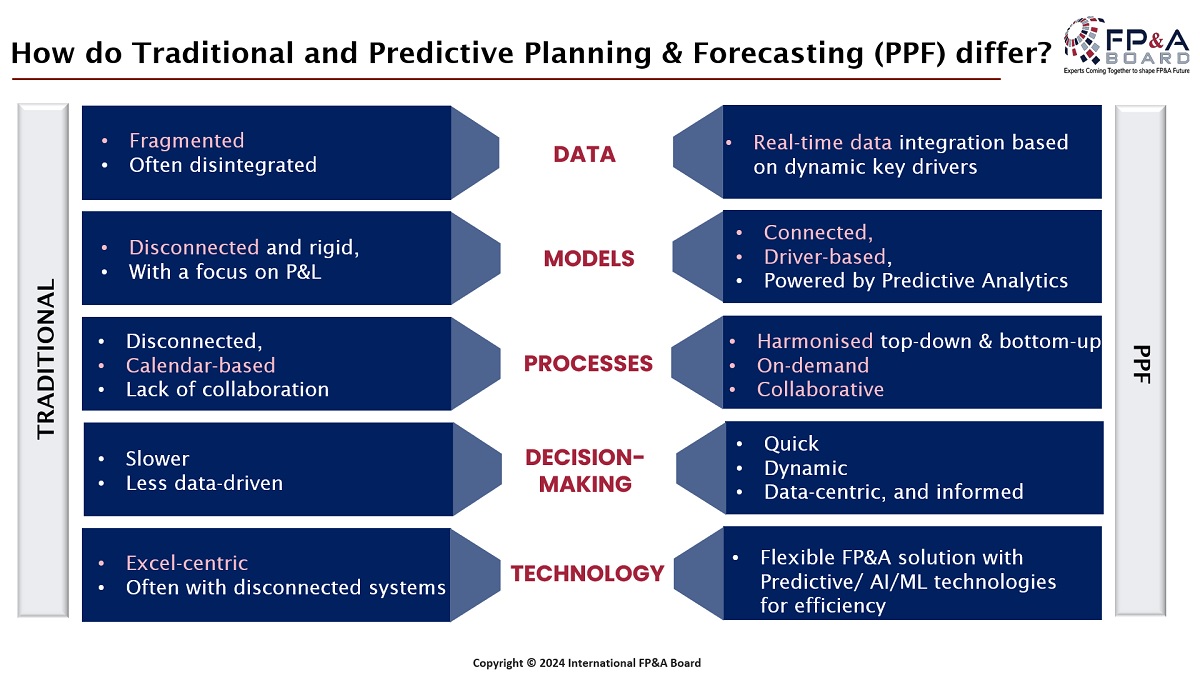
Figure 3
2. Key Elements of the PPF Framework
The London FP&A Board members addressed the Gartner Analytics Maturity Model, consisting of the following:
- Descriptive Analytics – What happened?
- Diagnostic Analytics – Why did it happen?
- Predictive Analytics – What will happen?
- Prescriptive Analytics – What can we do?
In practical terms, how can Predictive Analytics (PA) and Machine Learning (ML) enhance PPF? The distinction between PA and ML is determined by scope, learning and applications. PA means using historical data to make predictions about future events or outcomes. On the contrary, ML is a type of Artificial Intelligence (AI) that allows computer systems to learn from data and make predictions without being explicitly programmed. Both rely on historical data.
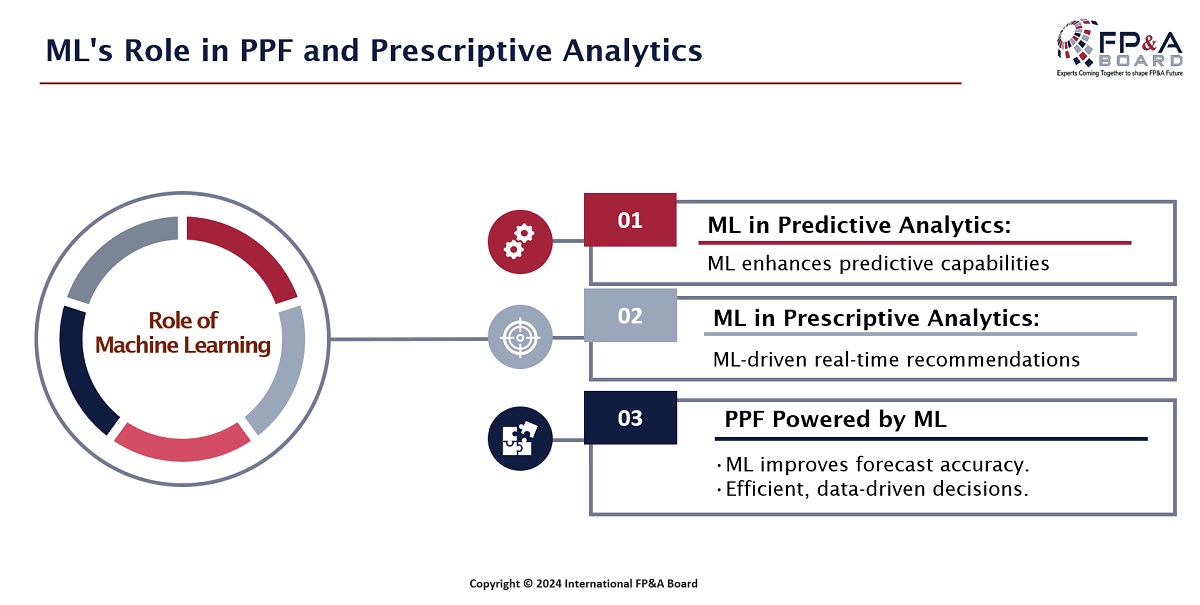
Figure 4
Ideally, the FP&A team is skilled in Prescriptive Analytics and refers to the advanced data analysis technique that not only predicts future financial outcomes but also provides specific recommendations on optimising financial decisions to achieve desired goals. Implementing ML enhances the capabilities of Predictive Analytics. Furthermore, ML drives real-time recommendations and empowers PPF by improved forecast accuracy and efficient, data-driven decision-making.
The latest findings from the FP&A Trends Research Paper show that only 14% of organisations are employing fully driver-based models, with only 3% using Predictive Analytics with AI/ ML.
To stay competitive, FP&A leaders must be agile and deliver forecast scenarios promptly based on real-time data utilising ML-based Predictive Analytics. Where to start with and how to make PPF with PA and ML a success story is demonstrated in the following section.
3. Practical Insights from the Field
Tanbir Jasimuddin, Director, COO Transformation at DWF, leads a large digital transformation initiative across the finance function in DWF Law. He specialises in leveraging analytics and digital technologies to drive organisational performance and efficiency within the finance function. Based on the handy example ‘Predicting Employee Attrition’, Tanbir explained how Predictive Analytics can be applied to several stages of the forecast value chain. In traditional forecast models, you enter ratios for each driver or conversion metrics based on your targets or expectations. You can use Predictive Analytics to calculate or project these ratios as outlined below.
We start with a business problem and understanding the ROI. For instance, employee attrition results in lost productivity and high recruitment costs. If we can predict who will leave, we can intervene earlier. The next step is identifying what variables are influencing the outcomes (exploratory data analysis). E.g. satisfaction levels, number of hours, sick days, performance scores, promotion frequency, tenure, etc.
The follow-up question is what is the relationship between these variables? A recommendation uses past data to define the influence of each on others and the relationship between variables. You can create correlation heatmaps and clusters as part of this process.
Finally, you can build, train and test a prototype model, and it will predict who will leave based on data collected on the variables.
How can you get started with Predictive Analytics?
There are three essential components to get started:
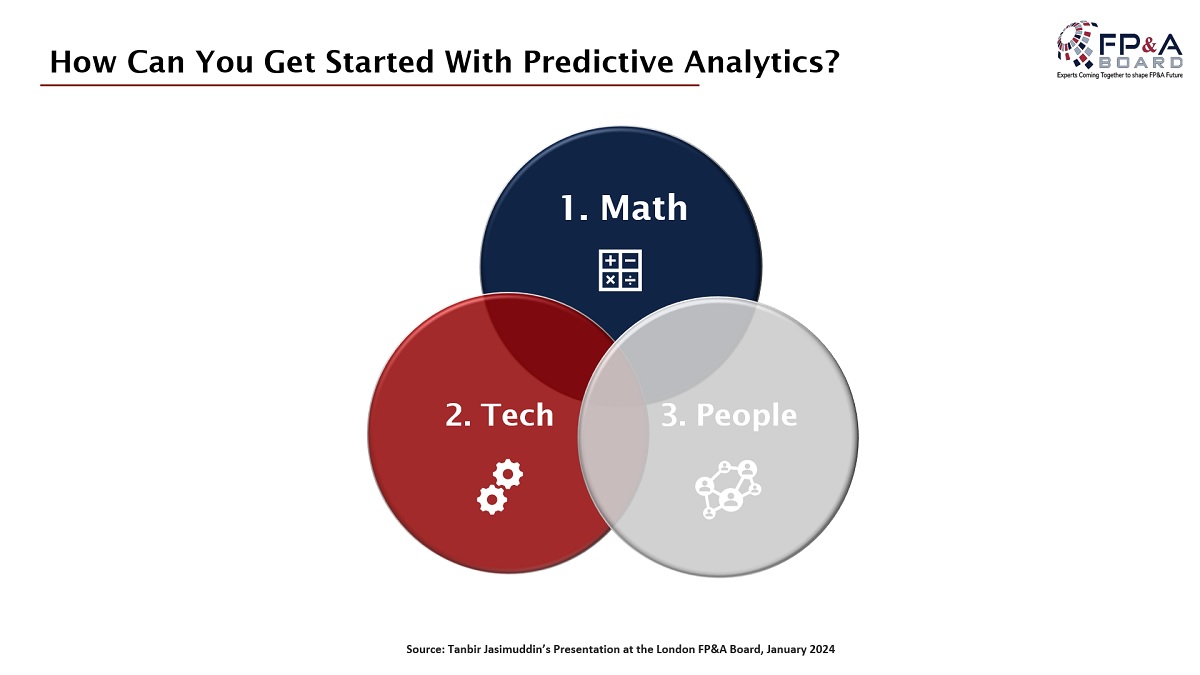
Figure 5
1. The Math: A couple of methods dominate the algorithms. Most of the math used a form of regression with a bit of time series. Typically, you are either projecting (regression models) or classifying (decision trees). These techniques are not new, and you don’t need supercomputers to run them. It’s even possible to run it on spreadsheets. Of course, you will have challenges with scale, ingesting the volume of data and repeatability.
2. The Tech: The human brain can handle a handful of variables at a time; the machine can handle hundreds simultaneously. The tech is more available than often assumed. Open sources democratise access to analytics with algorithms and code readily available on forums. It is increasingly incorporated within tech stacks.
3. The People: Why is the adoption of Predictive Analytics so low in FP&A?
A few reasons contribute to this fact:
- Getting usable data can be tricky.
- We don’t make enough space to learn.
- The “black box” can be an obstacle.
- And finally, we don’t always act on the predictions.
4. Roadmap to Implementation: Navigating the PPF Maturity Model
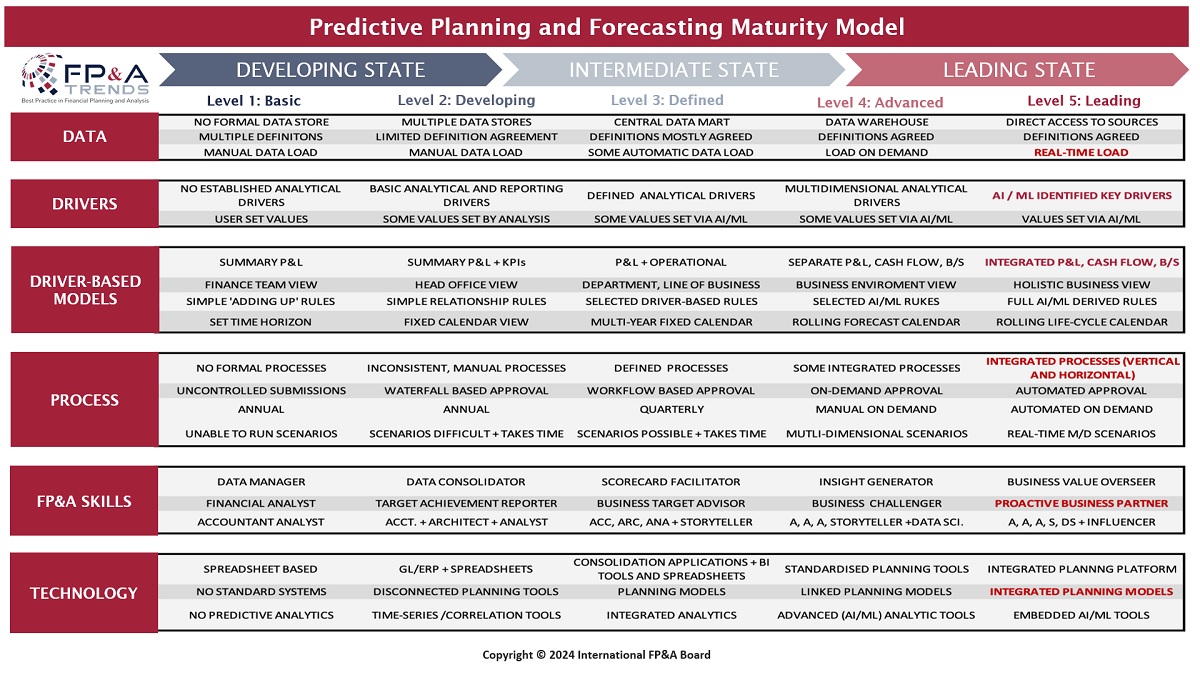
Figure 6
The FP&A Trends Predictive Planning and Forecasting Maturity Model showcases the journey from a basic PPF to the leading stage, based on 5 levels. That final, leading stage represents an organisation where planning and analysis add real value and allow the business to cope with a future that is difficult to predict.
When reviewing the own internal situation, it is recommended to evaluate the following pillars: Data, Drivers, Driver-based Models, Process, FP&A Skills and Technology.
An aspirational situation means the following in terms of Leadership:
- Strategic, business and operational plans are fully aligned,
- The decision-making process is completely analytics-based,
- Planning processes and goals are strategic and span multiple years.
The desired status in terms of FP&A Data & Analytics is:
- Having an integrated 3-way model with P&L, Cash Flow and Balance Sheet that is fully driver-based and predictive.
- Every decision is based on data.
- Having a single source of data with an agreed taxonomy and automated data feeds. In turn, the data should be easy to analyse using Predictive Analytics.
- There is a data strategy that allows access to operational and financial data for a better analysis.
5. Group Work: Conclusions and Recommendations
As the subsequent topic of the agenda, the attendees discussed practical steps in implementing PPF. The first group dealt with Data and Models and shared their experiences regarding structured and unstructured data when establishing PPF.
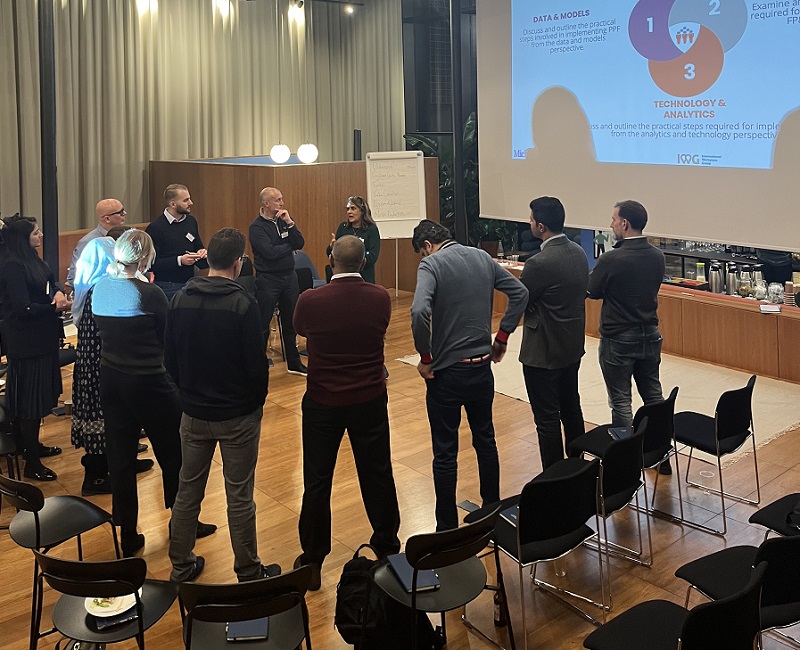
Figure 7: Group Work, London FP&A Board №32, January 2024
The second group examined the required FP&A Skills.
The identified skill set includes business, technical and soft skills.
The third group debated available Technology and Analytics.

Figure 8: Group Work, London FP&A Board №32, January 2024
The kick-off 2024 London FP&A Board turned out to be a thoroughly successful evening with engaging exchanges among experts. It was rounded off by lively networking under the roof of Battersea Power Station.


