This article delves into the importance of data management in forecasting, data accuracy and completeness, common...

I’ve been reflecting on Nate Silver’s book “The Signal and the Noise: Why So Many Predictions Fail but Some Don’t” and what it means for Financial Planning and Analysis (FP&A) professionals. FP&A professionals are asked to look forward and predict the future. However, no one really knows the future, so we should ask ourselves how we are helping the business when we look into our crystal balls with our economic forecasts.
The Difference between Predicting and Forecasting
First, I want to comment on the difference between a prediction and a forecast. Many people may think they are the same, but they are different. Here’s how Nate Silver explains their difference.
- A prediction is a definite and specific statement about when and where something will happen. For example, an earthquake will hit Kyoto, Japan, on June 28. For financial analysts, we might be saying it like, “June’s new business will be $732,000”.
- A forecast, on the other hand, is a probabilistic statement considering a longer timeframe. There is a 60% chance that a major earthquake will hit Southern California over the next 30 years. For us, this might mean something like, “Our estimated growth for the remainder of the year is 7%, based on 15% new business offset by 10% lost business and 2% market lift. We have a confidence interval of approximately 2%.”
We are often asked for a forecast as if we can predict the future by analysing data. Simultaneously, we know that forecasts have a high degree of uncertainty. How much is this uncertainty, and how is the forecast useful if it lacks certainty? It depends on how we create these forecasts, what assumptions we make, and what we do with the information.
Why Are We Forecasting?
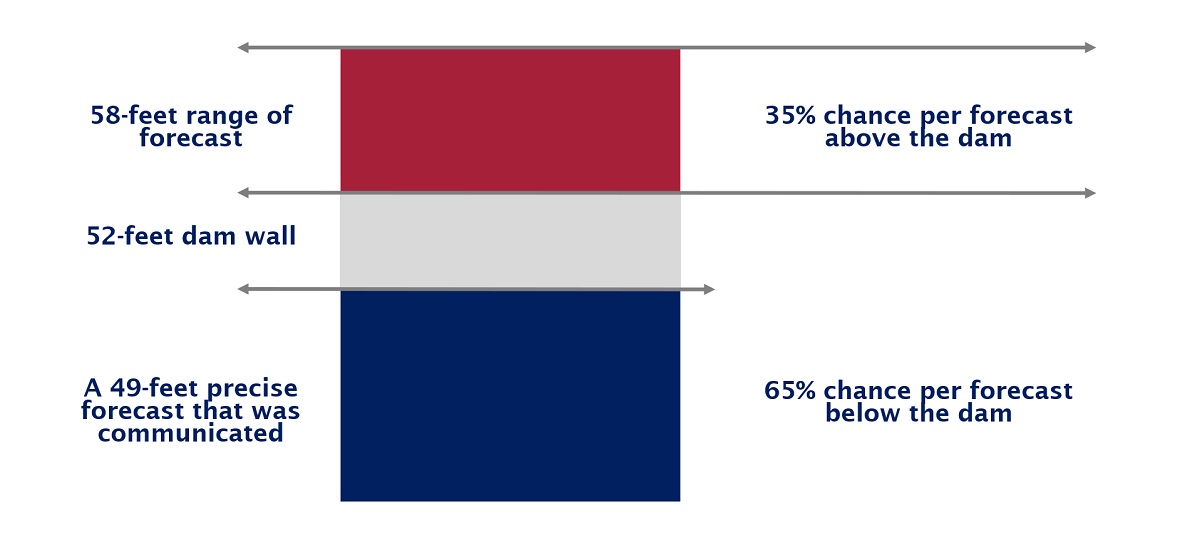
Knowing why we are forecasting is critical. If it’s just a task, that’s part of our job. For example, we will fill out this spreadsheet because our boss told us to do so. Such an exercise has limited usefulness, so knowing why we are forecasting is essential. Let’s start with a simple example from the book about how to drown in three feet of water. In April 1997, the Red River in North Dakota unexpectedly flooded, causing the city’s 50,000 residents to evacuate and billions of dollars of clean-up costs. This problem could have been prevented with a more robust understanding of the National Weather Service’s (NWS) forecast. Everyone knew there was heavy snowfall in the winter, and when the snow melted, the river would rise. The NWS’s forecast called for the river to rise to 49 feet, which was seen as a precise number within the 52-foot dam set up to prevent a flooding disaster. What the forecaster didn’t communicate effectively was the range for the forecast. It was plus or minus 9 feet, meaning there was a 35% chance for flooding and action easily could have been taken to avoid it. Still, there was a 65% chance the action would not be needed.

Figure 1: Sample flooding forecast
The lesson for us is to know the tipping points in our forecasts when levers might need to be pulled. Communicating uncertainty in our forecasts is critical, along with Scenario Analysis for cases when our forecast is worse and better than expected. Forecasting cash flows is necessary to ensure that we have enough cash to run operations. On the contrary, our managers may be more focused on financial incentives that need to be hit for paying bonuses, both for themselves and individuals working for them. Additionally, forecasting is critical for workforce planning with human resources, e.g. when to add or cut staff and how much we can afford.
What Model Are We Using For Forecasts?
Everyone knows that causation and correlation are not the same. Nevertheless, we are often asked to analyse past data to predict the future. While many times correlated things have a causation effect, sometimes they don’t. A once famous “leading indicator” of economic performance was the Super Bowl winner. From 1967 to 1997, the stock market gained an average of 14 points when the NFC team won and feIl 10 per cent when the AFC team won. A standard statistical significance test would have implied there was only a 1 in 4.7 million chance that the relationship had emerged from this competition. It was only a coincidence; the indicator has performed poorly since 1998.
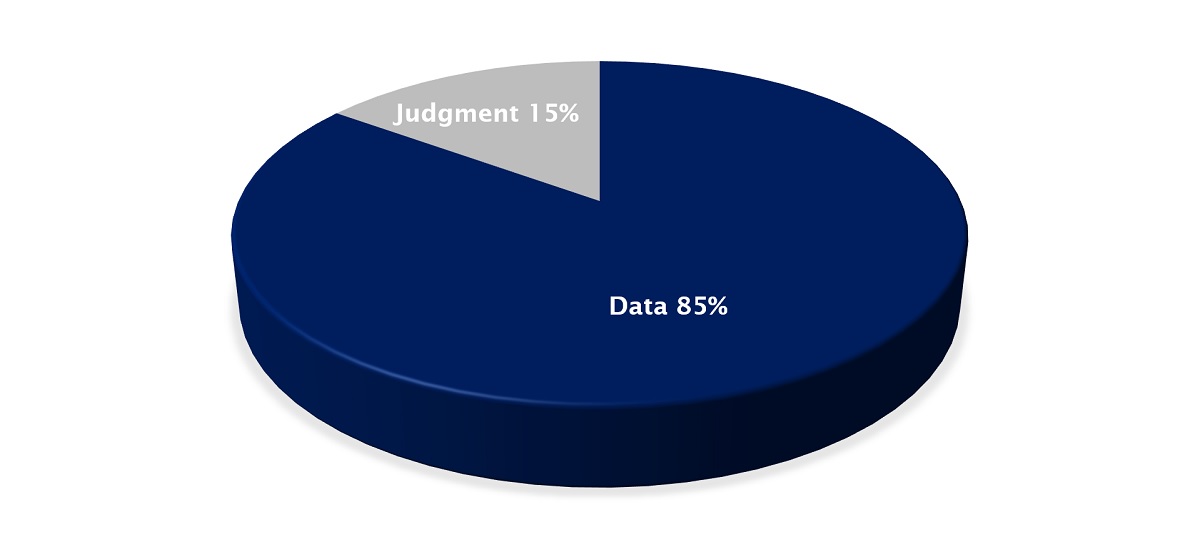
What’s the takeaway for FP&A analysts? It is important to understand how we build our forecasts, as the forecasting methods and assumptions may need to change over time. The forecasts need to be built with a combination of past data analysis, understanding of relationships between variables, and meetings with business leaders to test assumptions. Curiosity about why things are the way they are and asking good questions is critical for a good forecaster. In his book, Nate Silver points out that the best forecasters typically use about 85% data and 15% judgment in their forecasts. Simple models are generally more useful than complex ones, as it’s easier for business managers to understand how we’re forecasting. However, in the age of Big Data and Artificial Intelligence (AI), we are tempted to use more sophisticated models. They have a risk of “overfitting data,” which means considering the noise in the data, like the abovementioned Super Bowl winner, instead of discovering the underlying structure that influences future performance. Sophisticated models also tend to underestimate the evolving business factors, while past digits may not be a good indicator of future performance. Finally, we like to tell managers about variables they can control to deliver outperforming results instead of implying results that are more driven by coincidences, which can be used to excuse poor performance as the result of the perfect storm.
Can We Be Biased in Our Forecast?
Another interesting point in Nate Silver’s book is that biased forecasts may be rational. The less reputation you have, the less you may lose by taking a big risk when you make a prediction. Conversely, if you have established a good reputation, you might be reluctant to step far out of line even when you think the data demands it.
The risk lies in telling our managers what they want to hear when a forecast is highly uncertain. If there’s a 75% chance that we can do minimal work and give a reasonable forecast, we might choose to tell our managers what they want to hear. This can also prevent us from realising the benefit when our forecasts are reasonable – are we learning from our forecasts? Did we get lucky in avoiding something bad, or are we taking action to improve ourselves? From my experience, we tend to spend more time fixing problems than helping our average parts turn into outperformers. We should use our forecasts to identify our strengths and weaknesses so we can act to make ourselves better and build coalitions with the business as a strategic Business Partner. In theory, a great leader may have a vision and weigh the various options in a data-driven way. But in reality, management is more about managing coalitions and maintaining support for projects so they will be funded. If we obtain funding for a project and the forecasts fluctuate at the last minute, we likely don’t drop the project.

Figure 2: Sample illustration of data analysis and judgement distribution in forecasting according to Nate Silver’s book
Takeaways
Being a good forecaster is a combination of understanding the business, available data and being a competent Business Partner. Curiosity about the business and anticipating a range of scenarios is important as good forecasts typically comprise 85% data and 15% judgment. In the 85% data portion, it’s definitely efficient to adopt tools like Artificial Intelligence. However, we should remember that the 15% judgement is still very important. Understanding why we are forecasting is also essential to ensure our data is used in decision-making. The best-case scenario is to build the hypothesis for testing and scientific methods in our forecasts. This will only happen when there is a high degree of trust between the FP&A professionals and the business leaders.
Subscribe to
FP&A Trends Digest

We will regularly update you on the latest trends and developments in FP&A. Take the opportunity to have articles written by finance thought leaders delivered directly to your inbox; watch compelling webinars; connect with like-minded professionals; and become a part of our global community.


