Nick Arzenton, Head of Finance GDO-IBO at Orange Business, shares how one of Orange Business's branches...

Forecasting accuracy is one of the topics that is regularly discussed when working in FP&A.
But what is forecasting accuracy?
Forecasting accuracy is the ability to give a reasonable outlook of the business financials relative to your expected sales volumes.
In this two-part article, I will show you how to improve forecasting accuracy using a manufacturing organisation as an example. I will also share a perspective outside of FP&A through the Quality Department techniques.
Forecasting consists of two equally important components: the Profit and Loss statement (P&L) and the Balance Sheet (BS). In the first part, we will focus on P&L and sales forecasting, while the second will cover the Balance Sheet.
Sales Forecasting
To get the best base for other components of your forecast, start with sales forecasting and get the rest from there. Unfortunately, we did not spend much time understanding our accuracy during my career. At the time of writing, I am working within Quality Management, being responsible for the Integrated Management Systems, and I see how important processes and continuous improvement of those systems are.
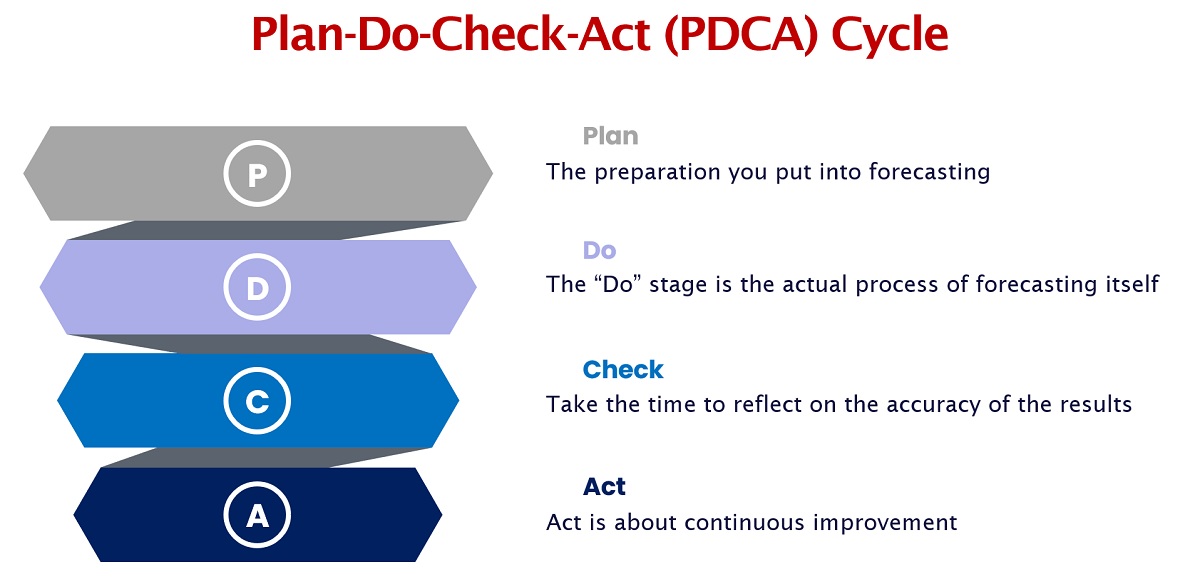
Within Quality, there is the Plan, Do, Check, Act (PDCA) cycle that exists and should also be applied within the forecasting cycle. It is important to get the sales forecast right, as it is a critical assumption for many of the forecast components.

Figure 1
Plan
The preparation you put into forecasting can be in the “plan” part of the forecasting activity. This may include meetings with the sales and marketing departments to gather the proper information.
You will need to do this with feedback from the sales department. As an FP&A leader, you must be involved in these discussions and serve as a “check and balance.”
Most salespeople are optimists. Obviously, they should be. Nobody wants people who don’t think they can increase sales. However, as an FP&A professional, you should challenge the sales department with questions such as:
- “What is causing this sales increase?”
- “Where is the historical data to support the trends moving forward?”
- “What is your strategy to increase sales, and what proof do you have to move forward?”
The level of detail behind this depends on how far you look within the sales forecast. There are long-term, mid-term and short-term forecasts.
If we look at the planning time frame, your accuracy will depend on the amount of detailed information behind the forecast. In long-term planning, it is crucial to understand marketing trends. Many things like COVID and political conflicts cannot be planned beforehand. In general, FP&A will need to work with your marketing department to understand the trends for your specific market over the long term. The longer you try to plan, the more difficult it may become based on the market you are forecasting. You should consider this when looking at the time you devote to your sales forecasting.
If we look at a shorter time frame, such as a year or less, there should be more concrete plans in place to understand how your business will be able to obtain their goals. You should question and push for supporting data if there is no evidence to support an increase or decrease.
Do
The “Do” stage is the actual process of forecasting itself.
Many CRM and sales forecasting tools are available, and FP&A professionals should leverage them.
You can try different things and choose the most suitable option for your company. The quality of data input is paramount for the abovementioned kinds of software. If you want an accurate output, you will need to ensure an accurate input.
Another important consideration for ensuring forecasting accuracy is to examine your company’s infrastructure capability and determine whether it may support the forecasted sales.
I have worked in manufacturing for 13 years and have much experience in this field. An example I have seen and pushed back against was a sales increase expected to be supported by one of the plants. One part of the issue was the plant capacity, which could not support the increase because of a lack of labour. While the plant might provide the capacity to add shifts and the machine capability existed, they were unable to hire enough people to staff these shifts. They had spent over a year and could not increase the headcount. However, it wasn’t caused by a lack of effort, as the unemployment rate in the area was less than 4%. Understanding your infrastructure’s capacity to support a sales number is crucial. That is why you should always test whether the numbers brought to you by others are real.
As a financial professional, you should not allow politics to interfere with forecasting accuracy. The desire to hit numbers may influence the forecast and not necessarily be related to reality.
Check
After working in Quality for a year, I have seen different methods to help improve accuracy.
I have worked for three organisations: two very large and one a smaller manufacturer. I see that if the finance department does not generate money for the company, it usually becomes stretched thin. Once one cycle is over, it can move to a budget, do a working capital analysis for new machinery, or even do an analysis for Mergers and Acquisitions (M&A) to help expand the business. That is why it is imperative to take the time to reflect on the accuracy of the results and then see if we were right or wrong.
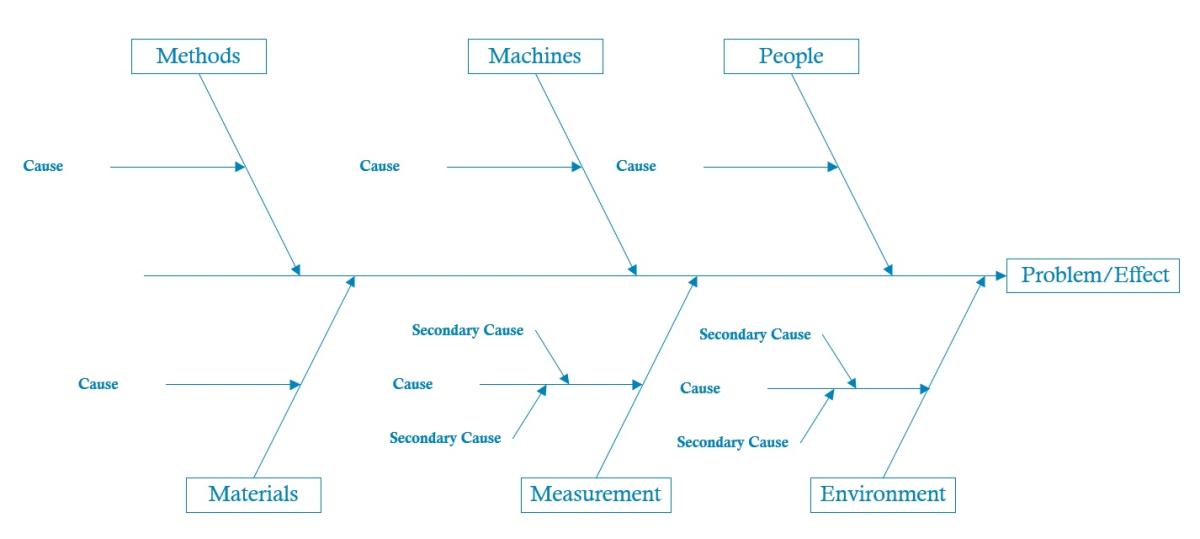
One of the tools our Quality team uses to help diagnose an issue with a product is a fishbone diagram.

Figure 2: A Fishbone Diagram
The above diagram shows how we can gather information. While the example comes from manufacturing, it can be utilised as your check to determine the causes of forecasting inaccuracies.
Most fishbone diagrams will use the following categories:
- Methods
- Machines (in the case of finance, it could be software)
- People
- Materials (once again, it could be replaced by a more relevant category)
- Measurement (time periods, annuals versus monthly)
- Environment (working remotely versus on-site)
Act
The final step within the PDCA cycle is the “Act”. Act is about continuous improvement. Continuous improvement can help you determine the causes of your inaccuracy and then take action to improve the accuracy. As forecasting always happens in cycles, it is easy to employ this method since the finance function is one of those departments already used to work within a set timeframe.
This method can be easily added to your department, and you will see a marked improvement in your forecasting accuracy. Then, you will begin the cycle again. It will continue in your next planning period. Improving your sales forecasting may subsequently improve your overall forecasting accuracy since so much of your forecast depends on this first step.
In the next part of this series, I will discuss the Balance Sheet and Working Capital and introduce more quality techniques that you can apply to improve your forecasting accuracy.
Subscribe to
FP&A Trends Digest

We will regularly update you on the latest trends and developments in FP&A. Take the opportunity to have articles written by finance thought leaders delivered directly to your inbox; watch compelling webinars; connect with like-minded professionals; and become a part of our global community.


