As long as there are humans involved in making a forecast, the forecast will be biased...
 Do you measure and publish the seasonal accuracy of your forecast? You should. Users of your forecast will experience next level decision-making power gains. This is just as vital as improving overall forecast accuracy.
The benefits of measuring seasonality of accuracy are that users can plan high/low scenarios for each prediction based on the season-specific range of possibilities. Departments can adjust how much capacity, safety stock, or cash reserves are needed based on their own worst case. And it's easier to determine missing factors for model improvement when you focus on adding predictors to the high noise areas of the model.
FP&A experience has probably taught you to always consider seasonality in your forecast. But, that experience doesn’t often make the jump to considering seasonality in the accuracy of the forecast. Classic Forecast Accuracy metrics don't help. They measure the average accuracy, just like unsophisticated budgets assume monthly averages without seasonality. So, let's dig into what we're actually going to measure to achieve this next level of decision-making power!
Example Seasonality Variations:
Here's a fictitious company: Nate's Lawncare Co. in a very warm climate. The fall weather determines how much work we get in November. As you can see in Figure 1, 2015 was a long season, 2016 was a short season, and 2017 was a mixed bag. Weather forecasts are only good for 45 days at most, which means we can't reliably predict November 2018 weather early enough to do our Annual Planning.
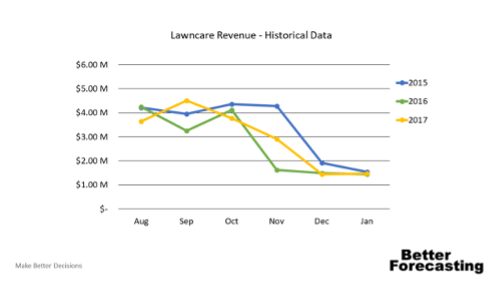
Figure 1. Large seasonal volatility driven by weather.
Now, let's forecast 2018 numbers. November's prediction will be the average of all three previous November sales, shown in Figure 2. If we use the traditional Forecast Accuracy metric and we have a Forecast Accuracy of 95%, then there's an implied forecast accuracy that could be applied to the prediction. Since the implied forecast accuracy doesn't consider specific months, the average implied accuracy would be applied to November. In reality, we know there's no way November's forecast is going to be as accurate as other months.
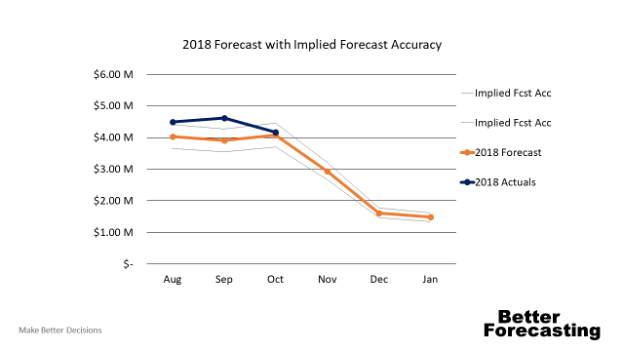
Figure 2. Classic Forecast Accuracy inference uses average accuracy, even in months we know are volatile.
If we move away from averages, then we can model the uncertainty around a specific factor: the month of November. Figure 3 shows what it looks like if we consider the error of each month separately. By considering error by month, we can see that there is much more error in our prediction than the other months. The statistical method we're using is called the Prediction Interval at ±95% probability but calculated with the error that applies to the prediction. Now that we have this information we're going to build our plans for several scenarios in November based on the range of possibilities.
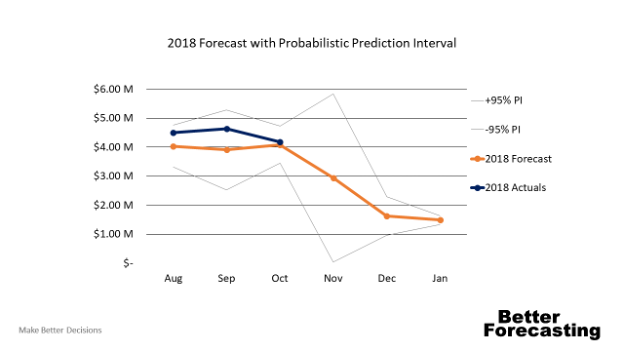
Figure 3. Probabilistic forecasting or the use of Prediction Intervals will highlight when predictions are uncertain.
Real World Seasonal Error
Let's look at some real data from a real company. Most companies aren't going to have seasonality that's as obvious as the example, but that doesn't mean it's not there. Figure 4 is the forecast residuals by month and year for a Facilities Construction and Maintenance Company.
It's clear that December is a very difficult month to predict, whereas August has a prediction that is quite good. When presenting this forecast to the leadership team, we have some huge advantages as a team when planning operations. For instance, we were able to run multiple scenarios for December and spend our managerial time planning for contingencies in months that are more likely to need them.
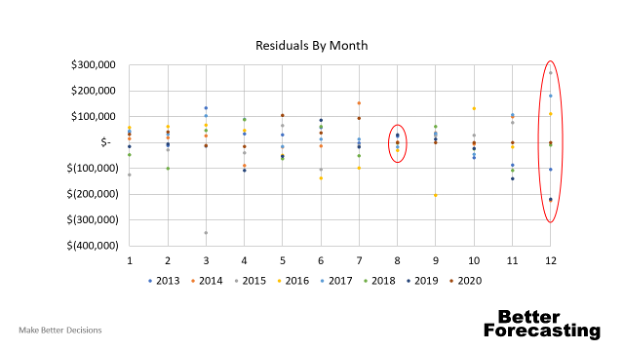
Figure 4. Real-world seasonality in forecast residuals.
Plan for Worst-Case… Who's Worst Case?
Let's say we have a company called FP&A widgets. We forecasted that we'd sell 2,000 widgets in January. In reality, we sold 3,200. That's great right? Well, if I'm in sales or finance, yes… but if I'm in inventory or Ops capacity planning, that's terrible news… I'll be told to be happy about it, but I will miss the timeline and cost goals that I'm measured against.
Often in forecasting, you end up with each function padding the numbers and writing a plan that wastes time and money in unused resources. Truth be told, that is because different functions have different worst cases, and they're often padding the numbers based on the worst-case error they've experienced. They won't know when you've made improvements and where they apply, so your company will experience delays in the benefits of improved modelling. If you predict and publish the expected error, it will revolutionise the decision-making power of the forecast for each function.
When the forecasting team starts to identify what the high and low probability is for a forecast, each individual function can start to write better plans based on the additional information. Figure 5 shows some examples of this change by function.
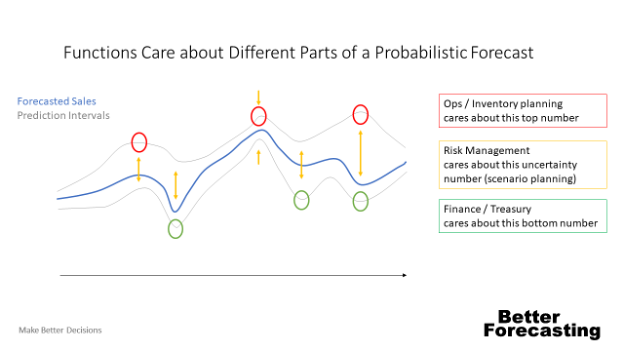
Figure 5. Each function has a different definition of worst-case which becomes visible when FP&A teams publish seasonal errors.
Forecast Improvement Treasure Map
Prediction Intervals will improve the FP&A teams ability to find previously unrecognised drivers. If the forecast is off by 15% one month, average based Forecast Accuracy metrics are not going to provide any useful triage information. Knowing that 15% error is within the 95% Prediction Interval tells me that we can improve the forecast by looking for drivers that are occurring each year. If 15% is outside the 95% or 99.7% Prediction Intervals (2 or 3 sigmas respectively), then we know there's a new unique driver that isn't part of the previous year's data.
Real-world example: a road construction company in Dallas had a prediction that was off by $650k revenue in a month. That amount of error was four sigma away from the prediction. It was WAY outside the 95% range for the factors we were including thus far. So the FP&A team started asking questions.
The ops team said: "Oh, It rained."
Turns out if there are more than 8 inches of rain in Dallas in a month, there are significant delays in road work. With that information, we found 11 years of historical rainfall in Dallas and were able to quantify the impact of rainfall in our forecast. What a great story! It was only obvious that we were missing a factor because we had quantified the noise associated with our existing factor predictions.
Level-up the Decision-Making Power of Your Forecast
Ok, so where do you start? Start by plotting residuals vs every input factor you have similar to Figure 4. Two, work on incorporating error bands, or prediction interval bands into the forecasts that you use with each department based on those error drivers. Three, publish a primary case and a high/low case at a standardised probability, such as 95%. finally, train and work with each department to determine which probability level they want to set their departmental targets.
The decision-making power of each department in your company will be greatly improved with this new information.
I look forward to hearing any great stories from your work in this area! Please feel free to reach out on LinkedIn and share your battle stories in this arena. Keep up the good fight!
Subscribe to
FP&A Trends Digest

We will regularly update you on the latest trends and developments in FP&A. Take the opportunity to have articles written by finance thought leaders delivered directly to your inbox; watch compelling webinars; connect with like-minded professionals; and become a part of our global community.


