
This article will focus on is the modeling of a company as a whole, its consolidated...

Why 3-Statement Forecasting is not Enough
May 27, 2020
 In the previous article, I discussed what constitutes a model for the purpose of forecasting the future values of a variable. A model specifies the cause that changes the values of that variable. A forecast that simply assigns future values based on prior experiences is not a model. In this article, I elaborate on the meaning of specifying the cause of change by showing why 3-statement forecasting is not enough for FP&A.
Consistency vs. Possibility
Imagine handing in the 3-statement forecast in Table 1 to a company’s CEO. In this forecast, the key assumption is that revenue grows 20% a year for the next two years. The future balance sheet and cash flows are adjusted accordingly for consistency. I have intentionally omitted all other parts that are not connected with the change in revenue.
Table 1. Simply 3-statement forecast
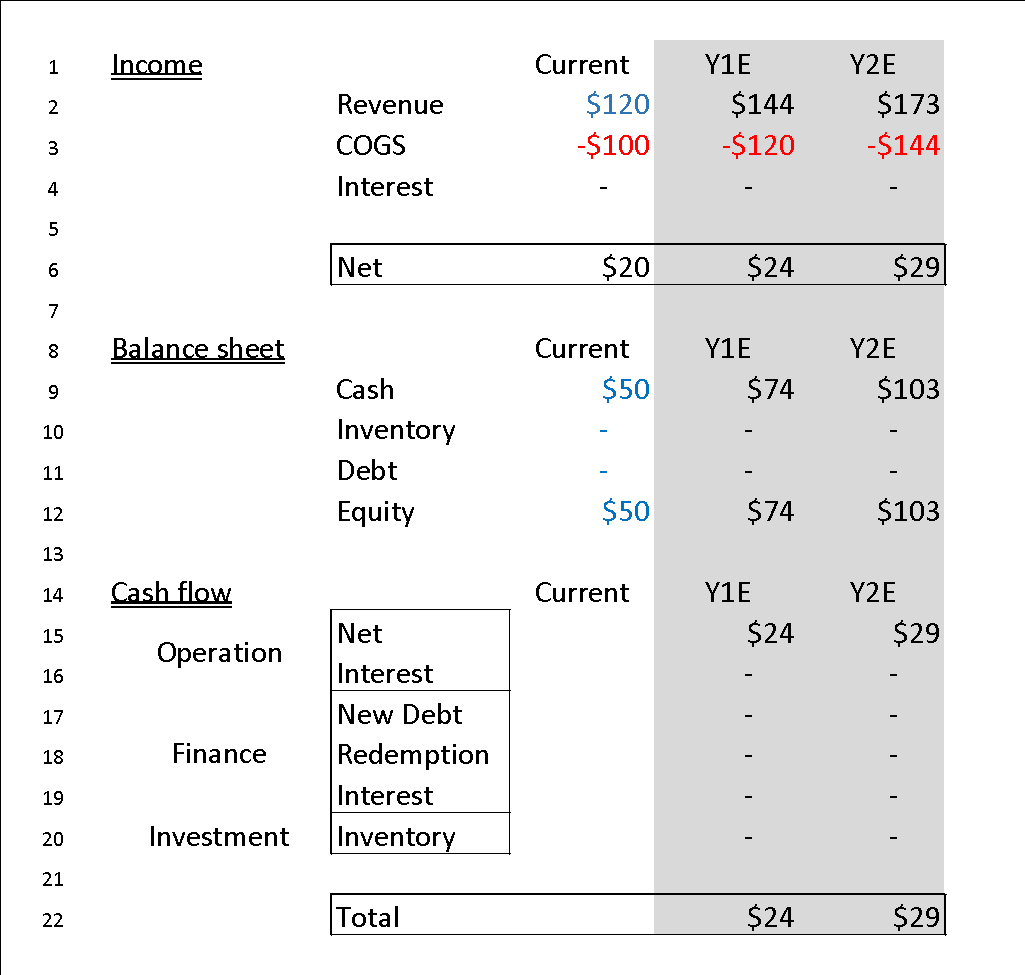
A likely reaction of the CEO is: “Hm, this forecast doesn’t really help planning for the future.” Will it help if we add more to the forecast, like inventory and debt? In the forecast below in Table 2, inventory and debt values are added and forecasted to grow 20% each year, just like the revenue. The three statements are adjusted again, so they are mutually consistent. Does this forecast provide more insight to the CEO about the future?
Table 2. More complicated 3-statement forecast
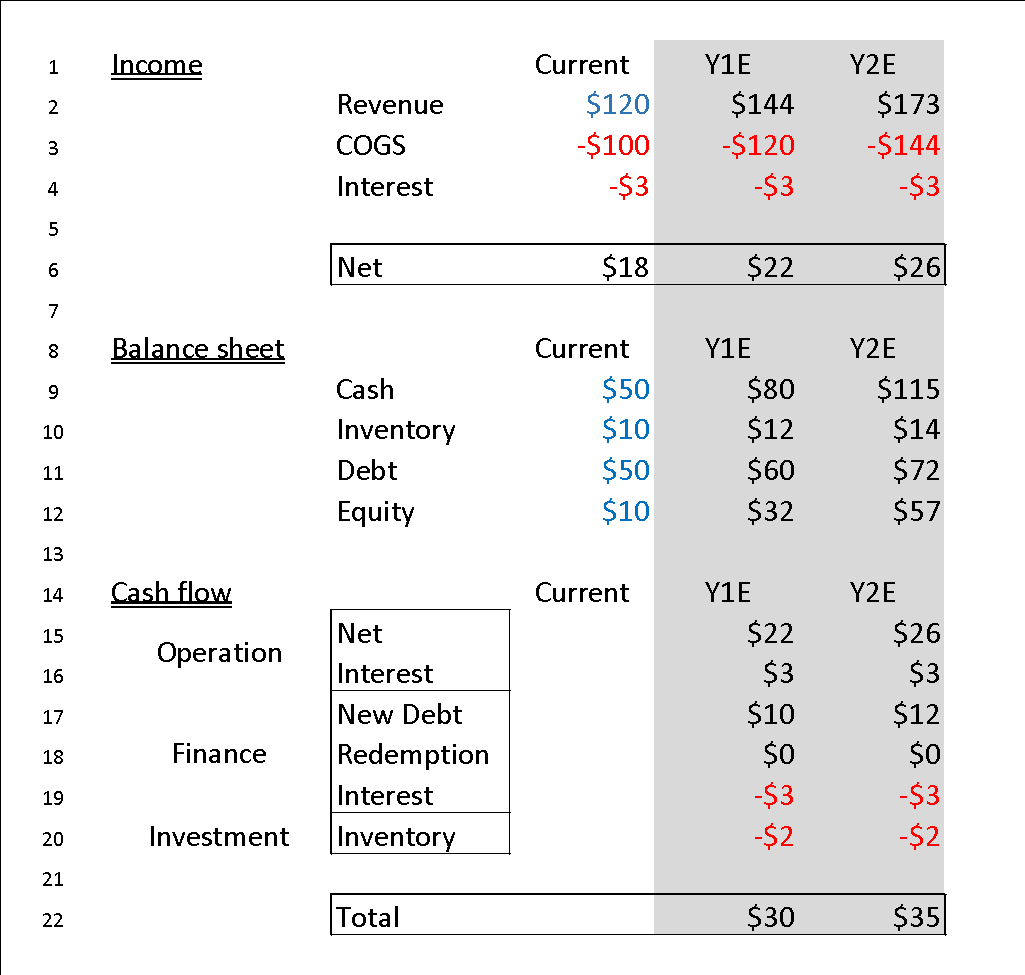
Not really. The additional information we added does not improve the first forecast. because we could have assumed different growth rates, in fact, any arbitrary rates, for the inventory and debt and still forecast the same growth rate of the revenue. The problem with this kind of forecasting is that it tells only what will happen if it happens. But an even bigger question is that while we can make the 3 statements consistent in accounting under any random growth rates of revenue, debt and inventory, are these growth rates consistent with each other in real life?
Kinematics vs. Dynamics
Using the football analogy again, imagine a soccer player trying to kick the football past the 20 meters height. You can inform the footballer that if he can achieve his goal, the velocity of the ball at the 20-meter mark will be higher than zero. That forecast is certainly consistent. But the footballer is probably more interested in how to get the ball to that height than what happens if it does get there.
In physics, kinematics specifies the relationship among different measurements of an object. Sounds like accounting? Dynamics, such as Newton’s law of gravity, describe whether or not it is possible for an object to get to a location by specifying the cause of change. Let us put the physics laws into a narrative that is more understandable to financial professionals.
Little vs Big movement
Newton’s law does not directly answer whether or not a big movement, such as the ball reaching 20 meters high, is possible. Instead, it states that there is just one possible kind of infinitesimal movement on earth at all times – one with the change of velocity pointing downward at 9.8 meters per square second. This may not sound that impressive, but here is the catch: any other movements on earth, any at all, no matter what, from a flying football to earth circulating satellite to the moon, must be made up from repeating this one little basic movement and this one little movement only.
Imagine a Lego set which has only one kind of block, and you have to build everything using only that. When scientists try to compute the trajectory of an object around the earth, whether it is a football, a satellite, or the moon, all they do is faithfully repeat this one little movement in Newton’s law and see what final movement can be made out of it.
So here are the two key steps of forecasting with a dynamic model:
The critical first step is to specify the allowed basic changes. The second step is to faithfully, unperturbedly and tediously iterate the basic changes from the first step to come up with all possible future changes.
Basic and Non-basic changes in business modelling
What are the basic and non-basic changes in the modelling of a company? The basic changes are those changes that a business can execute as a basic integral part of its business operation. For example, a manufacturing company uses cash to buy inventory, or a large corporation raises capital by issuing bonds. These are the actions that the business is reasonably confident they can execute in their routine. Unlike Newton’s law, there is definitely more than one kind of basic changes in business (more than one kind of block you can use in the Lego), but nevertheless, there is only a finite number of them for each business.
The non-basic changes are those that a company tries to achieve but cannot take for granted it can, such as growing revenue by 20% every year. Let us get a close look at the first forecast in terms of the balance sheet change it has specified.
Focus on the balance sheet change in Table 1, in which cash and equity, and only these two, increase from $50 to $74. I name this kind of change “unilateral cash increase”. This is a consistent accounting change that retains the balance sheet’s balance. Nevertheless, it should NOT be a basic change. Why? Because having a positive change of our net worth, either as an individual or a company is not a change that can be taken for granted. This change is HARD to implement and achieve (unless the company is a deposit institution or if the company is issuing new shares).
A Unilateral Cash Increase is a balance sheet increase in equity that is accompanied only by an increase in cash. It cannot be a basic change for a non-bank company.
The unilateral cash increase can certainly be the final RESULT of several basic changes, but for financial modellers and planners, the job is exactly to figure out what basic changes it takes to achieve this result.
Forecasting example
Let us use the forecasting example to illustrate this methodology. Imagine that the company buys a product (inventory), then sells it at a higher price, and borrows to finance its inventory purchase. Below are four kinds of basic balance sheet changes we can define in the forecast:

In these changes, C, I, and B are the original level of cash, inventory and debt; d (assumed to be positive) represents the amount of change made; m is the profit or loss that the company gets from selling. Balance sheet items not showing are not changed, except for equity which is assumed to always change to keep the balance sheet balanced.
Note that each basic change automatically implies an income statement change. Change #1 and #3 are equity neutral and hence generate no income. Change #2 increases equity by m hence generating a positive income, and change #4 decreases equity by d hence generating a negative income. Note that change #4 is a unilateral DECREASE in cash and hence is allowed as a basic change.
What is our forecast if it is based only on these basic changes? In Table 3 below, the year-one forecast is broken down into four basic steps shown in the grey area of the balance sheet. In step 1, the company executes change type #3 with d = $72 (the company borrows $72). In step 2, the company makes a change type #1 with d = $122 (the company buys $122 inventory). Step 3 is a change type #2 with d = $120 and m = $24 (the company sells $120 inventory and makes $24 profit). Step 4 is a change type #4 with d = $6 (the company pays $6 interest on debt). We assume the debt maturity is longer than 2 years.
Table 3. Forecast of year one based on the basic changes
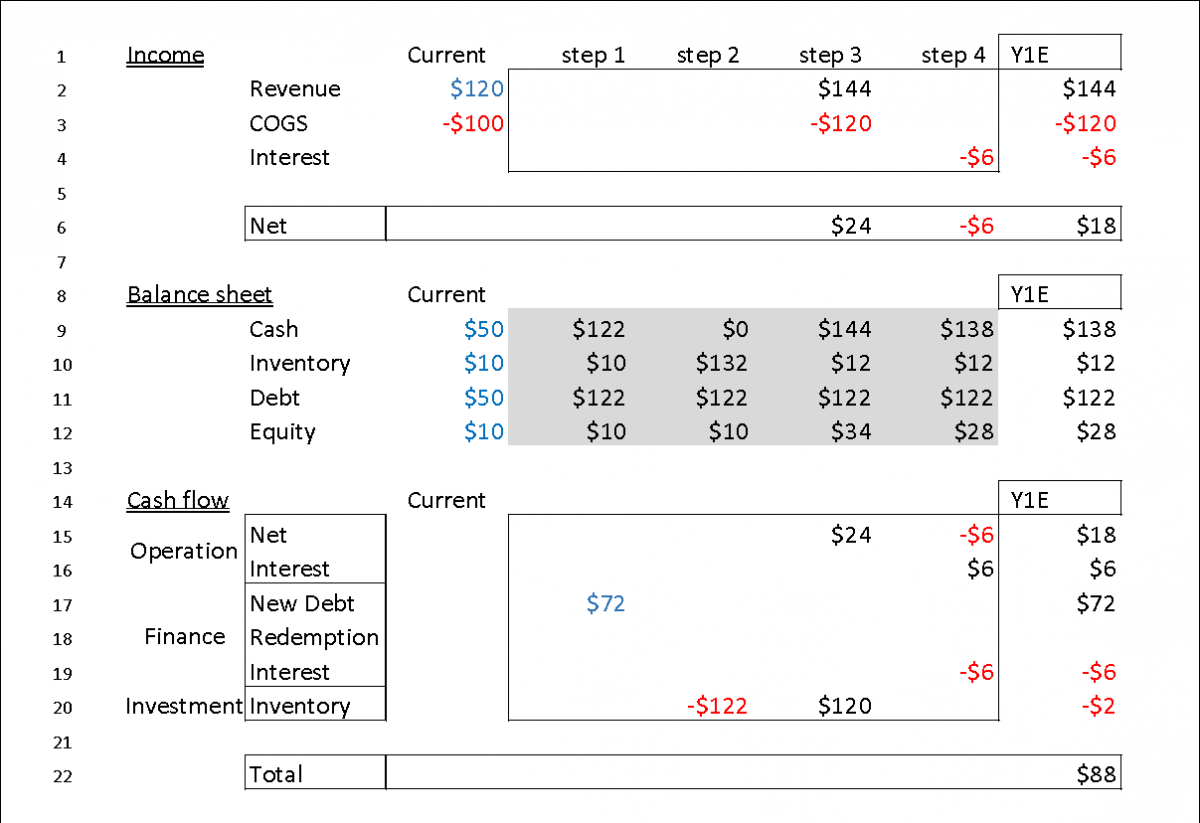
The final change of the balance sheet is shown in the last column. Note that each basic change implies the corresponding changes in the income table and cash flow table.
Modelling based on basic changes eliminates the need to separately forecast and reconcile the 3-statements.
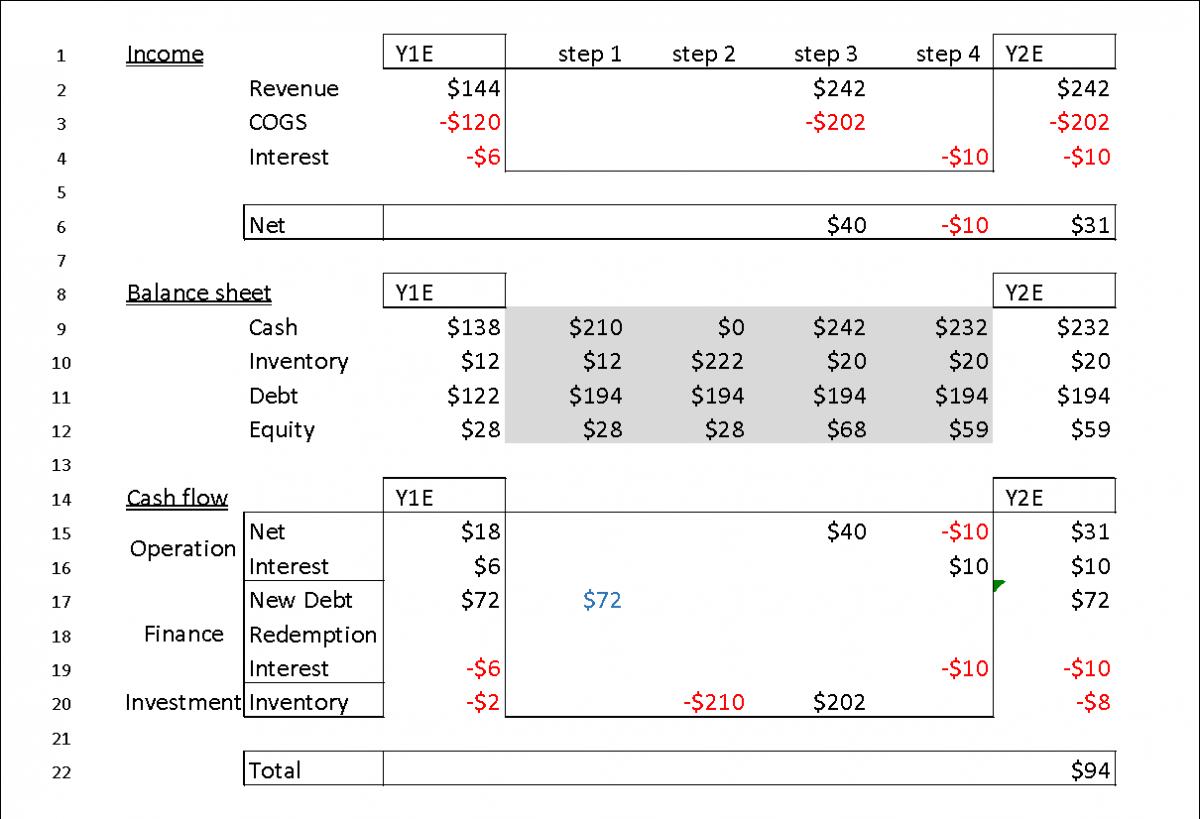
The forecast shows that inventory does grow 20%, as the first forecast has assumed, but debt does not. In order to achieve the assumed revenue growth, a debt must increase by $72. But we get more than just that difference. If the four basic changes are repeated again in year two, then even if the company borrows the same amount of $72 debt as in year-one, the revenue will grow much more than 20% if the company sells the inventory with the same turnover rate and profit margin as in year-one (see table 4). This shows how nonlinear the final change can be even if the underlying operating conditions are constant.
Table 4. Forecast of year two based on the basic changes
Financial modelling and Operational modelling
The results in Tables 3 and 4 depend on the operating metrics – the sales margin and the inventory turnover rate, which the modeller must discover from the management. This integration of operational change with financial change is fundamentally built into our methodology, as shown in the basic change types #1 and #2 above. In a dynamic forecast, the changes in all balance sheet items are interconnected and interdependent as they should be in reality.
Summary
The example I give is a highly simplified case which serves only to illustrate the modelling approach. The approach echoes with some ideas I have read at FP&A Trends. For example, zero-based budgeting has been discussed a great deal. The example above shows that the basic forecasting horizon should not be a period in the accounting calendar (month-end, year-end), but rather should be the steps of the basic changes. These changes define the modelling and planning time unit.
Another idea I see a lot is integrated modelling and planning. To the extent that the integration refers to the integration of financial and operational modelling, the current approach builds this integration at its very foundation.
Here is the final summary:
- Dynamic modelling begins with only a balance sheet.
- The heart of modelling is to specify the allowed basic changes to the balance sheet.
- Build all future changes by iterating and combining only the basic changes.
- Income and cash flows are generated from the basic changes in the balance sheet.
- The basic time unit in forecasting matches the steps of the basic changes, not the accounting calendar.
- The basic changes integrate financial and operational changes.
The full text is available for registered users. Please register to view the rest of the article.
Related articles

Disclaimer: Financial Modelling has no strict “right” or “wrong” method of application. It does, however, have...

Financial model definitions can be tricky. Financial models are often dependent upon numerous functional areas and...

At the third meeting of the AI/ML FP&A Committee, Xena Ugrinsky, Principal and Founder at GenreX...

Sometimes, what you forecast needs to change dramatically, due to e.g. market disruption or internal changes...

Rolling Forecast can become the path leading to better company’s profitability and improved operating performance. This...
+
Subscribe to
FP&A Trends Digest
We will regularly update you on the latest trends and developments in FP&A. Take the opportunity to have articles written by finance thought leaders delivered directly to your inbox; watch compelling webinars; connect with like-minded professionals; and become a part of our global community.