
Financial model definitions can be tricky. Financial models are often dependent upon numerous functional areas and...

Financial Modelling: What is Common Between Football and Finance?
March 27, 2020
 Background and Motive
I speculate that I have stumbled into this community of financial professionals with a rather different background. I have worked on the trading side of the industry for more than twenty years. With the implosion of the mortgage industry in 2008, my job changed into the primary market to debt issuance and later credit rating. This change shifted my focus from individual securities to companies as a whole. It was during this time that I realized the lack of analytic tools that directly model a company’s cash flow.
The reasons behind the lack of direct cash flow modeling on a company as a whole became evident when I attempted to do the modeling myself. I realized that people in different areas of finance have very different foundational ideas on the model and forecast of a company even though they are speaking of the same subject. I hope to share my understanding and my way of financial modeling in a series of posts to perhaps connect some of the ideas and concepts in this field.
A disclaimer: What I will focus on is the modeling of a company as a whole, its consolidated future financial positions, incomes, growth and risks, as opposed to the detailed budgeting of one specific aspect of a company’s business, such as how to increase contract to sales conversion rate.
What is NOT modeling
When modeling for real-world applications, we almost always deal with the time series of a variable. For example, with revenue, we are interested in the values of revenue over a period of forecasting horizon, such as four quarters each year for the next 5 years. That is a 20 steps time series.
We are NOT modeling if we directly state the time series of values for a variable. For example, if a model STARTS by giving 20 values of revenue for the next 20 quarters, it is not really a model for revenue. These given values may be based on long-term experience and may turn out to be correct, but still, even though we have an excellent experience with revenue, we do not have a model for revenue.
A model is NOT a model if it states directly one or more time series that is EQUIVALENT to the time series we are trying to predict. For example, a model directly states the time series for Price and Volume, and then use Revenue = Price * Volume to predict the Revenue. Revenue / 2 or Revenue * 2 does not provide a model for Revenue either.
What is Modeling
So, what is modeling? We all agree that the time series of the value we try to predict is not constant. The value will change from one time-step to the next. A model establishes the CAUSE for this change at each time step.
Take the example of predicting the positions of other planets in the sky all year round. Mankind accurately recorded these positions since a very early time. However, we did not have a model until Newton, whose gravitational model describes not directly the positions of the planet, but what determines the rate of change of their position at each instant of time - the gravitational force. The position of a plant over time is then deduced through an iterative computing process: starting with the current position of the planet, applying the cause stated by the model to derive how much the position will change and therefore the new position at the next time step, then applying the cause again to the new position to get the still new position at the next time step, and so on, until as far to the future as desired.
Perhaps this sounds as far removed from financial planning as the planets from the earth, but the reasons behind modeling the changes of value apply equally to financial modeling and planning.
Why Modeling the Change
A central issue in FP&A modeling is how to make the forecasting more predictive and less extrapolative. Take the example of a football thrown by a quarterback in a long pass. The ball climbs in the air higher and higher until it starts falling, tracing a non-linear hyperbola trajectory in the air. Before we have the gravity model, it is natural for us to predict during the climbing phase of the ball that the ball may very well continue climbing. When the ball starts actually to fall, it is natural for us to attribute the cause to the emergence of a new cause – the ball is climbing because something is pushing it up, and the ball is falling because a different thing is pulling it down.
This approach of extrapolating based on near-term experience is also widely applied in financial forecasting. When a company is growing, we will assume it will continue to grow and we will not forecast of its eventual decline. And if the company starts to decline, we will contribute the reason to something bad that has just taken over instead of any intrinsic inevitability. In all these forms of rationalization, we are NOT PREDICTING change. We are simply responding to the occurrence of the change.
A model that models change can predict change. By knowing just the speed and angle of the football at the single moment it leaves the quarterback’s hand, the gravitational model can predict the exact height, distance and the time at which the ball will turn from climbing to falling. Furthermore, it predicts the change of flight direction WITHOUT introducing any new extraneous causes. The football has been under a CONSTANT gravitational force when it is climbing AND when it is falling. The change in flight direction is an intrinsic inevitability.
Corporate Growth as Football Flight
Corporate growth can follow the same mechanism. Replace the football by a company and the altitude of the football by the company’s cash level, we can get the same outcome. In the example I gave in the attached excel file, a simple but not unrealistic goods-selling company is modelled at every time step for how its cash level changes. This is expressed as a formula of Cash[t+1] in terms of Cash[t] for every time t.
Under the present assumptions given in the file, the company grows in cash for a few years and then starts to lose cash, all happening while nothing has changed about the company (Chart 1). You can change the static assumptions and see how the trajectory of cash level changes. The key lesson is that a growing company can start to decline even if all the financing and operating conditions remain unchanged. Furthermore, whether such an intrinsically inevitable decline occurs or not, and when if it does, can be predicted by the model long before the decline starts.
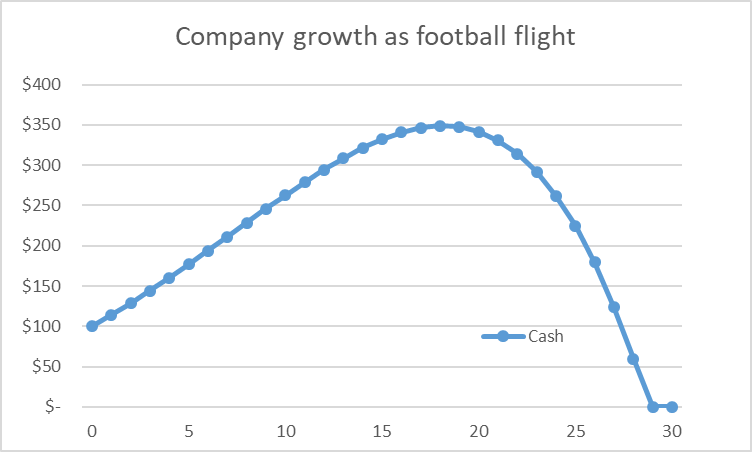
Chart 1. An example of a corporate’s cash level under constant conditions
A model that models changes can provide insight into the ultimate direction of a corporation's future, but more importantly, it provides insights on how to change the direction. Consider the company in the example trying to deter the decline when growth is slowing. The first reaction may very well be to reduce debt in order to save on interest payment. However, the model will show you this is exactly the wrong thing to do. You can verify this by modifying the file so that the ratio of new debt to cash can change over time. Chart 2 shows the result if the company borrows less new debt (the leverage ratio is reduced to 0.1 from 0.2) starting in t=14 before the decline. Instead of cash position improving, the decline actually starts immediately.
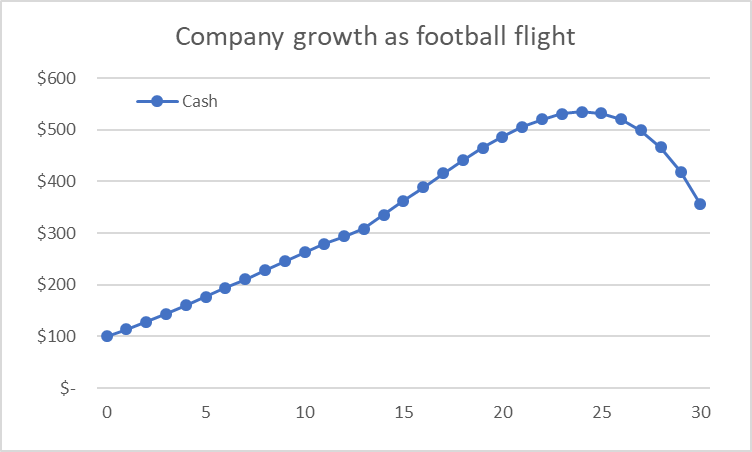
Chart 2. Reducing debt borrowing starts the decline even sooner
The right answer is to increase either the margin or the sales ratio. You can test which option is more effective. There is however a short-term solution that may be the most likely real action taken by a company - borrow more instead of less and grow the sales for now. Chart 3 shows the result if leverage is increased from 0.2 to 0.25 starting at t=14. The action only delays the cash fall to the future from a higher altitude.
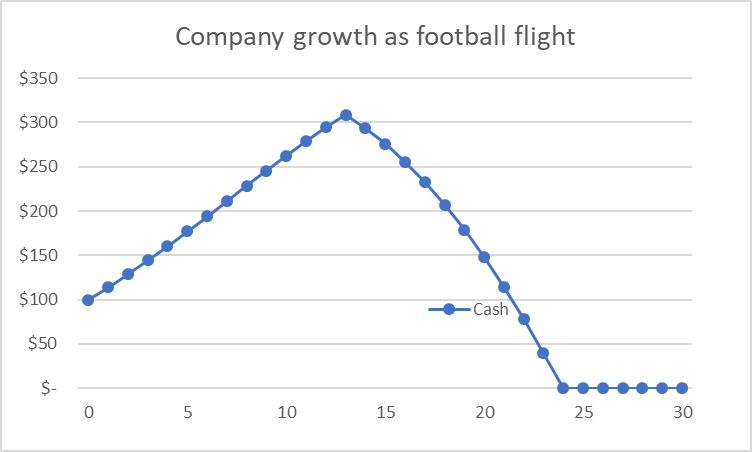
Chart 3. Increasing borrowing leverage delays the decline temporarily
Ending Words
The model in the example is highly simplified to serve a demonstration of my perspective of predictive modeling. The business world may seem too complex for these ideas to apply. First, there seems nothing constant in the business world like the force of gravity. A company’s margin, sales ratio or available credit all fluctuate. Second, there can be many possible intervening factors (uncertainties) in the real world. A gust of wind, another flying object, or the intentional act of a rivaling party can all suddenly change the football’s flight path, and their occurrences cannot be modelled or predicted. However, as I hope to discuss in my next post, these observations actually reinforce the power of the modeling approach covered in this article.
The full text is available for registered users. Please register to view the rest of the article.
Related articles

During the recent years, the level of detail and precision which financial modeling in the business...

In this article, I want to make the case for data-driven planning to describe the 7...
+
Subscribe to
FP&A Trends Digest
We will regularly update you on the latest trends and developments in FP&A. Take the opportunity to have articles written by finance thought leaders delivered directly to your inbox; watch compelling webinars; connect with like-minded professionals; and become a part of our global community.