
In today’s world, companies need more than ever fast insights to make the appropriate critical moves...

Leveraging Business Intelligence to Empower Finance Business Partnering and Profitability Analysis
September 5, 2024

Abstract
This article explores the pivotal role of Business Intelligence (BI) in enhancing strategic decision-making within large multinational organisations. As these entities increasingly depend on detailed insights for new product development, traditional financial ledger data systems often fall short due to their lack of granularity. The paper highlights how BI platforms address these limitations by converting broad financial ledger data into actionable insights tailored for finance teams to support Business Partnering and guide product and marketing teams. It discusses the evolution of traditional data systems, their inadequacies, and the transformative impact of modern BI tools. Additionally, the article covers unique methodologies and frameworks to convert data into valuable insights, the challenges of integrating BI tools, and the future potential of BI with Machine Learning and Artificial Intelligence (AI).
Introduction
The importance of Business Intelligence (BI) cannot be overstated. As the backbone of strategic decision-making, BI tools empower organisations to transform vast amounts of raw data into meaningful insights. However, finance teams often grapple with the limitations of traditional financial data systems, which lack the granularity needed for strategic Business Partnering and product development while remaining essential for reporting. These systems provide broad categories without detailed insights, causing a significant data gap. This article explores how BI platforms can bridge this divide through innovative data integration and analysis, converting raw data into comprehensive insights that finance teams can use to support their Business Partners and drive new product development.
Historical Context
Financial ledgers have been fundamental to financial accounting since the 14th century, capturing financial transactions systematically. However, their primary purpose was focused on financial reporting, but not detailed business analysis or product-level insight. BI tools have significantly changed data analysis approaches, enabling Predictive Analytics and better Strategic Planning. Despite the proliferation of BI tools, their application in interpreting financial ledger data for product development is often overlooked.
Challenges with Traditional Financial Ledgers
Financial ledgers are crucial for financial reporting, compiling and presenting transactions systematically. They include General Ledger accounts, cost centres, and other identifiers essential for financial organisation and analysis. However, ledgers often lack the granularity needed for detailed product-level analysis, making it challenging for product teams to identify key metrics and performance trends to make informed decisions.
Methodology for Deriving Business Insights from Ledger Data
The integration of BI tools in financial analysis involves the strategic use of static mapping tables to correlate disparate ledger data with specific business metrics. This process is fundamental in translating raw financial data into actionable insights, particularly for product teams focused on nuanced aspects of business performance.
Process for Creating Static Mapping Tables
Static mapping tables serve as a bridge between the general data recorded in financial ledgers and the detailed information required for sophisticated business analysis. The creation of such tables involves several key steps:
- Identification of Business Metrics: The first step involves identifying the specific business metrics relevant to the product teams. These metrics might include product-specific revenues, costs, margins and other Key Performance Indicators (KPIs).
- Analysis of Ledger Data Structure: Next, an in-depth analysis of the ledger data structure should be conducted to understand the available data fields and how they relate to the identified business metrics. This step is crucial for determining how ledger data can be mapped to business metrics.
- Designing the Mapping Logic: Once the relationship between ledger data and business metrics is understood, the mapping logic is designed. This logic defines how data from different ledger accounts, cost centres and other fields, which should be aggregated or disaggregated to align with specific business metrics.
- Implementation and Testing: The mapping logic is then implemented to create the static mapping tables. These tables are tested extensively to ensure accuracy and reliability in correlating ledger data with business metrics.
Once the mapping tables are ready, the next step involves using the ledger feed to derive insightful trends. This process allows for a comprehensive analysis of financial data, uncovering patterns and trends that inform strategic decision-making. By leveraging the structured mapping tables, the ledger feed provides a clear and detailed view of financial performance, facilitating a deeper understanding of key metrics and operational efficiencies. This approach ensures that data-driven insights are both accurate and actionable, enhancing overall financial management.
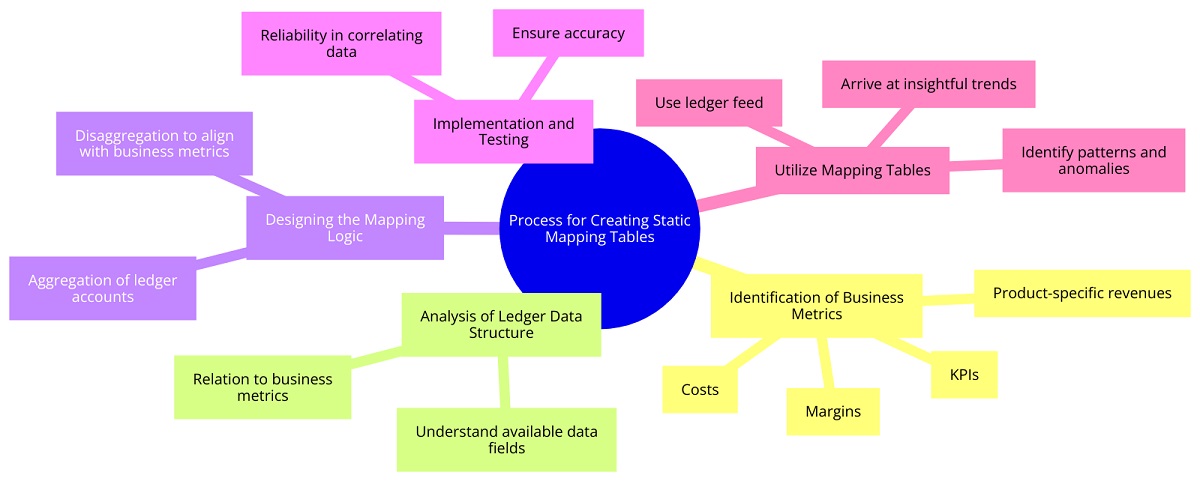
Figure 1: Mind Map Diagram Illustrating the Process of Creating Static Mapping Tables
Case Study: Implementation of BI Tools
A notable case study involves a multinational bank that implemented BI to enhance its product Profitability Analysis. The bank faced challenges in assessing the profitability of individual banking products due to the generic nature of its ledger data. By creating static mapping tables, the bank was able to allocate revenues and expenses for specific products, despite these details were not directly available in the ledger. The implementation of BI tools enabled the bank's product teams to access dashboards that presented product-specific financial metrics, such as profitability, growth rates, and customer acquisition costs. This level of insight was instrumental in informing strategic decisions regarding product development, pricing strategies, and promotional activities.
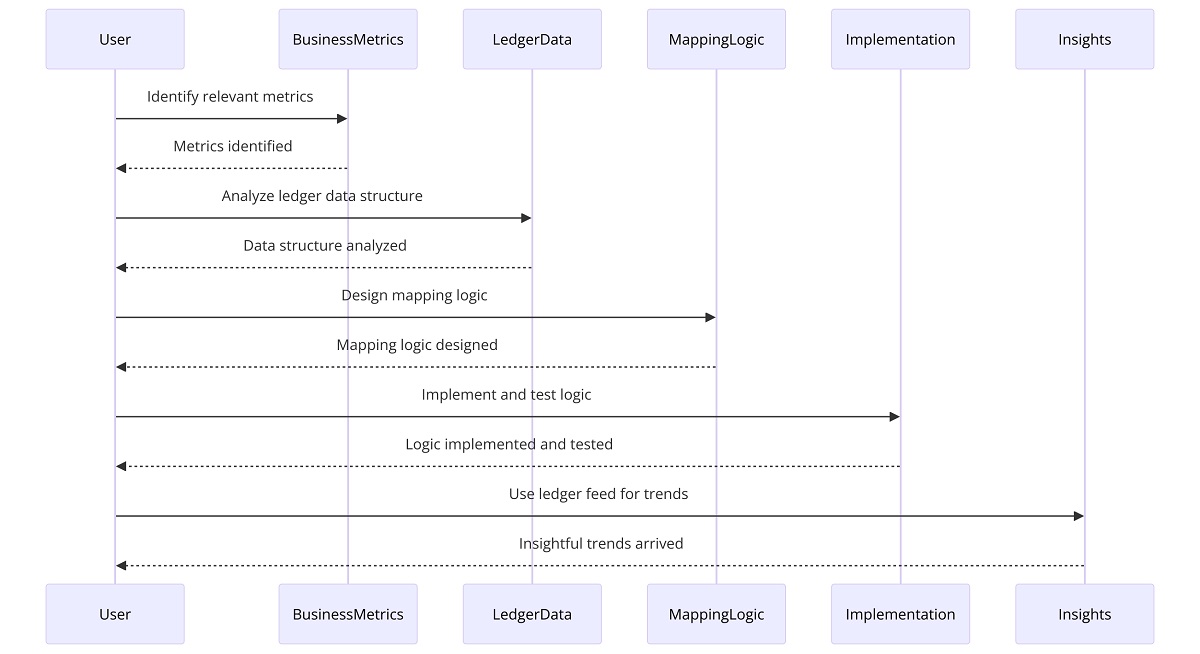
Figure 2: Implementation Steps Sequence Diagram
Challenges and Solutions
The process of creating static mapping tables and integrating BI tools has its challenges. Key among these are:
- Data Complexity: Organisations often deal with vast volumes of complex data, which makes the mapping process intricate and time-consuming.
- Data Quality: Inaccuracies in ledger data can lead to erroneous mappings, affecting the reliability of business insights.
- Evolving Business Needs: As business needs evolve, the static mapping tables may require frequent updates to remain relevant and accurate.
To address these challenges, companies can adopt several strategies, including using advanced data cleansing tools to improve data quality, implementing flexible mapping logic that can be easily updated, and fostering close collaboration between IT, financial and product teams to ensure the mapping tables accurately reflect current business needs and priorities. BI tools can transform ledger data into a strategic asset, enabling product teams to make informed decisions based on precise, product-level financial insights.
Practical Recommendations for FP&A Leaders Implementing BI Tools
Start with a clear understanding of organisational goals and how BI can align with these objectives. Identify Key Performance Indicators (KPIs) that are critical for business decision-making. Invest in quality data governance to ensure data accuracy and consistency across the organisation. Engage in cross-functional collaboration to gather input from various departments, ensuring the BI solution meets diverse needs. Prioritise user-friendly interfaces and robust training programs to encourage the adoption and proficient use of BI tools among team members. Continuously monitor and refine BI processes, leveraging feedback and advancements in technology to enhance analytical capabilities and drive better financial insights.
Future Prospects of Business Intelligence in Financial Planning and Analysis
The future of BI and data analytics in financial analysis is poised for transformative growth, driven by emerging trends and advancements in technology. One of the most significant trends is the integration of Machine Learning and AI into BI platforms. These advanced analytics techniques may dramatically enhance BI capabilities, enabling more sophisticated analysis of financial ledger data. Machine Learning algorithms can automate the identification of patterns and trends, predict future financial outcomes, and provide deeper insights into customer behaviour and product performance. This level of analysis can inform more nuanced product development strategies and financial management practices, offering businesses a competitive edge.
Furthermore, the increasing adoption of cloud-based BI tools is set to expand the data analysis possibilities, providing scalable, flexible and more efficient means to process and analyse large volumes of data. This cloud integration facilitates real-time analytics and collaboration, which is essential for agile product development and financial decision-making.
As BI tools become more sophisticated, organisations will likely witness a revolution in how financial ledger data is leveraged. The future of product development and financial management will increasingly rely on these advanced analytics, propelling entities towards more data-driven and predictive models and business strategies. This evolution promises not only enhanced efficiency and accuracy in financial analysis but also a new paradigm in designing financial products closely aligned with evolving market needs and customer expectations.
Conclusion
BI tools bridge the gap between traditional financial ledger data and the analytical needs of product teams. They enable detailed financial analysis, supporting product development and strategic decision-making. Despite implementation challenges, the benefits of leveraging BI tools for financial analysis and product strategic decisions are substantial, driving innovation and competitiveness.
References:
- Watson, H.J., & Wixom, B.H. (2007). "The Current State of Business Intelligence." Computer.
- Davenport, T.H., & Harris, J.G. (2007). "Competing on Analytics: The New Science of Winning." Harvard Business School Press.
- Kimball, R., & Ross, M. (2013). "The Data Warehouse Toolkit: The Definitive Guide to Dimensional Modeling." Wiley.
- Chen, H., Chiang, R.H.L., & Storey, V.C. (2012). "Business Intelligence and Analytics: From Big Data to Big Impact." MIS Quarterly.
The full text is available for registered users. Please register to view the rest of the article.
Related articles

The first step in forecasting is to understand where we are today and how we arrived...

This article explores the roles of Human Intelligence and AI in FP&A, supported by findings from...

In this article, the author outlines how AI transformation may impact the finance domain and explains...

4-5 years ago in Microsoft, Cloud business was a small portion of the overall business, but...

So, you got support from your executive leadership team and you hired or grown some talent...
+
Subscribe to
FP&A Trends Digest
We will regularly update you on the latest trends and developments in FP&A. Take the opportunity to have articles written by finance thought leaders delivered directly to your inbox; watch compelling webinars; connect with like-minded professionals; and become a part of our global community.