The Logical Thinking Process was originally developed by Dr. Eliyahu M. Goldratt, author of bestselling business...

Introduction
Some years ago, I was appointed Internal Audit Manager for the aftermarket operation of a major automotive manufacturer. My department was responsible for:
- 72 wholesaling centres
- 53 auto centres
- 12 commercial operations around the world
I began by introducing a planning process to help ensure that not only would risks be promptly addressed but also that audits would contribute to a professional management culture. The key was to focus on Internal Audit’s contribution to optimising the wider business system.
I will describe our Systems Thinking approach and show how it impacted FP&A and Management.
Systems Thinking
Systems thinking is a holistic approach focusing on how a system's constituent parts interrelate and how systems work over time and within the context of larger systems. This approach contrasts with traditional analysis, which studies systems by breaking them into separate elements.
Its origins come from:
- General Systems Theory, developed by biologist Ludwig von Bertalanffy, who proposed that there are universal principles of organisation across different disciplines.
- Cybernetics, which studies systems from the perspective of control and communication, particularly feedback loops. A key work is ‘An Introduction to Cybernetics’ by W Ross Ashby.
- System Dynamics, a method to model the behaviour of complex systems over time developed by Jay Forrester at MIT.
Systems thinking discourages a ‘silo’ mentality, where components of the business process are optimised individually and instead seeks to optimise the contribution each element makes to the whole.
Key principles include:
- Systems Mapping: Diagrams show the relationships and interactions between different system components.
- Synthesis: The whole system is the primary concern.
- Interdependence: Every part of a system can affect the performance of the whole. Systems thinking identifies the multiple cause-and-effect relationships that exist within a system.
- Feedback Loops: Different parts of a system can influence one another in circular cause-and-effect relationships, known as feedback loops.
- Emergent Properties: These are properties that emerge from interactions within the system, which would not be present in any component.
Let us see how these principles were applied to the business system that contained my Internal Audit department.
Systems Mapping
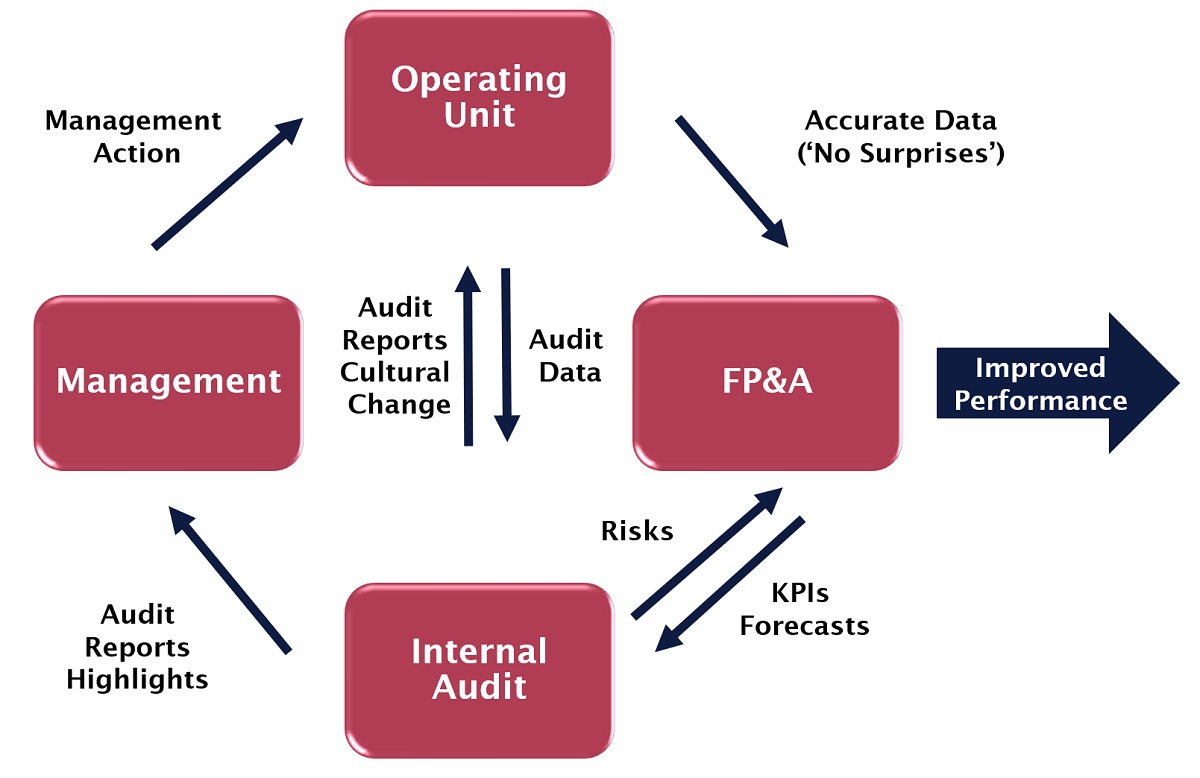
This diagram shows the scope of and interactions within our system:

Figure 1: The System Map Containing Internal Audit
Figure 1 shows how the functions of Management, Operating Units, FP&A and Internal Audit form a system within an enterprise. The output of this system, with its components working together, is improved performance. The arrows show the information flows between the functions, which are the components of the system. The more these functions work together optimally, the more business performance improves.
Let’s apply the principles of systems thinking to that shown in Figure 1.
-
Synthesis
The output was an improved business performance with respect to stewardship and effective use of assets. This is a subsystem of the business as a whole and is the scope of this article.
-
Interdependence
The Systems Map shows the information and control flows between the business functions.
- The Operating Unit provides:
- Accurate data – ‘no surprises’ – for example, no stock losses or sudden write-downs, to FP&A for effective forecasting and analysis.
- Detailed data to the auditor during the audit.
- FP&A provides:
- KPIs and forecasts from Operating Units to allow Internal Audit to prioritise and schedule audits. FP&A also provides much data to Management, but that is outside the scope of the system under consideration.
- Internal Audit provides:
- Reports on Operating Units to Management and to the units.
- Highlighted issues to Management based on digests of all audits.
- Risk analyses to FP&A for use in forecasting.
- Cultural change through the audit process itself.
- Management provides:
- Action to implement audit recommendations.
Feedback Loop
I would like to introduce the concept of entropy. Entropy is the tendency for systems to fall into disorder. This is prevented by achieving homeostasis. That is when a sensor monitors the environment and reports via feedback to a controller, and then the latter makes the necessary adjustments to keep the system stable.
Let us consider a heating system as a more digestible example. In a central heating system, the sensor is the thermometer, which measures the ambient temperature, while the thermostat is the controller which switches the heating on or off according to the thermometer’s feedback. Homeostasis, in this case, is a constant temperature.
In our case, Internal Audit and FP&A are sensors which measure the internal and business environments, respectively, and which, via feedback, allow the controller, Management, to take the necessary action. Homeostasis, in this case, is the optimum business performance.
Emergent Properties
Improved performance through cultural change is a synergy that emerges through the functions of Management, Operating Units, FP&A and Internal Audit working together as a unified system.
The above are the principles of systems thinking applied to our case. I describe how I built the Internal Audit department to optimise its function within the system, including its relationship to FP&A.
Defining Internal Audit within the System
To perform optimally within the system, Internal Audit needs:
-
The right people
My department was a mix of highly experienced branch auditors and more generalised qualified accountants. Our systems thinking and modelling approach allowed us to schedule individuals with the most relevant skills to the most appropriate audits while allowing crossover and shadowing so that auditors might learn from one another. The key to efficient training and development was good and automatic control of the scheduling process of 72 wholesaling operations, 53 auto centres and 12 overseas commercial operations.
-
Effective risk assessment
Audit templates formalised audit results as KPIs so that they would be comparable between units. Other KPIs from FP&A would also be considered: e.g. ‘Is the gross margin lower than we would expect for a business of this size and location?’, or: ‘Have there been significant variations from forecast?’, etc. Separate models were maintained for auto centres and wholesaling centres, and these would calculate risk by audit category through a z-score (unit score – mean score for all units)/standard deviation of the score for all units). These z-scores by audit category were summed into an overall risk score for each unit.
-
Efficient scheduling linked to risk assessment
The models then converted the risk scores into a schedule by allocating specialist resources. The riskier the location, the shorter the audit cycle.
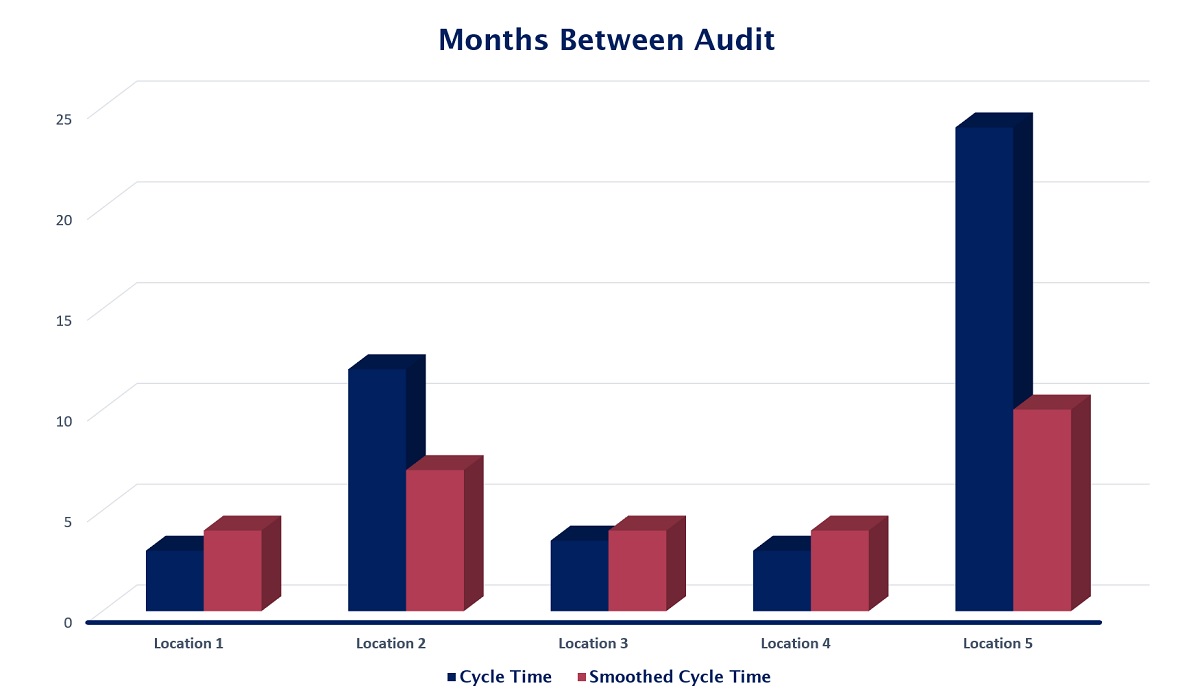
However, a linear mapping of risk to the audit cycle was sub-optimal. Circumstances could change quickly. A location that had scored well might turn out badly at the subsequent audit. The model took account of this by making sure the sum of the audit cycles was minimised – using Lagrange Multipliers. This is illustrated in Figure 2. The model slightly increases the cycle times of those locations regularly visited (e.g. Location 3 and Location 4) to achieve very large reductions in the cycle times of those locations visited less often (e.g. Location 5 – cycle time reduced from 24 to 10 months). Hence, all locations are visited as often as possible for a given resource level while maintaining the relationship between frequency and risk.

Figure 2: Smoothing the Audit Cycles to Ensure Frequent Oversight
-
Clear and formalised reports
A clear and consistent reporting style allows data to be readily absorbed, shared and aggregated by Management and other departments.
-
Good communications
Internal audit and FP&A are sensors monitoring the security of assets and the business environment, respectively. Open communication between them, the Operating Units and Management improves their effectiveness and the interpretation of their outputs in a wider context.
Using the Latest Technology
This system was implemented a number of years ago and was successful. Recent advances would make it even more effective:
- Advanced Analytics Software like Tableau or Power BI offer powerful data visualisation capabilities to perform sophisticated analyses of audit data.
- Machine Learning. A predictive model could be trained on historical audit data to identify patterns and predict future risk levels, leading to more accurate and dynamic risk assessments.
- Big Data. The ability to process and analyse large volumes of data would enable incorporating more factors into risk assessment, e.g. the inclusion of external data like local market trends.
- Cloud Computing. Real-time collaboration with other stakeholders would lead to improved decision-making.
Summary and Conclusion
The systems thinking approach proved to be a great success. It significantly reduced scheduling time, ensured that the audit frequency was risk-related and increased team effectiveness. Furthermore, Operating Units understood that audit frequency was automatic, remorseless and impersonal. The better the audit score, the longer the time before the next audit visit. The frequency of visits was entirely in the hands of local Management – this prompted interest in achieving the highest score possible, leading to improved results.
Subscribe to
FP&A Trends Digest

We will regularly update you on the latest trends and developments in FP&A. Take the opportunity to have articles written by finance thought leaders delivered directly to your inbox; watch compelling webinars; connect with like-minded professionals; and become a part of our global community.


