These notes were made during the meeting of the FP&A Board on 6th February 2020 in...
The London FP&A Board met on 20 April 2023 for the 30th meeting since its establishment. The event was attended by 23 finance leaders and senior FP&A practitioners across various sectors. The representatives of GSK, State Street, Genpact, London Stock Exchange Group, ConvaTec, Colliers, FirstGroup plc, AkzoNobel and many other companies discussed practical considerations for effective FP&A Storytelling, focusing on the building blocks of the narrative, visualisation and data.
The event was sponsored by Wolters Kluwer in partnership with IWG and Michael Page.
This article summarises some key takeaways from the meeting, including insights shared by Alex Sashenkov, Head of Commercial Finance at AkzoNobel.

Figure 1
The Significance of FP&A Storytelling
At the start of the meeting, participants shared their thoughts on what factors contribute to successful FP&A storytelling.
The most cited factors include:
- Actionable insights, being clear on the 'so what' and how it will influence decisions.
- Concise and focused messages.
- Know your audience, adapting the presentation where necessary for different stakeholders.
- Collaboration and feedback from stakeholders, ensuring the insights form part of the story for the business.
- Build engagement, relationship and credibility with business stakeholders.
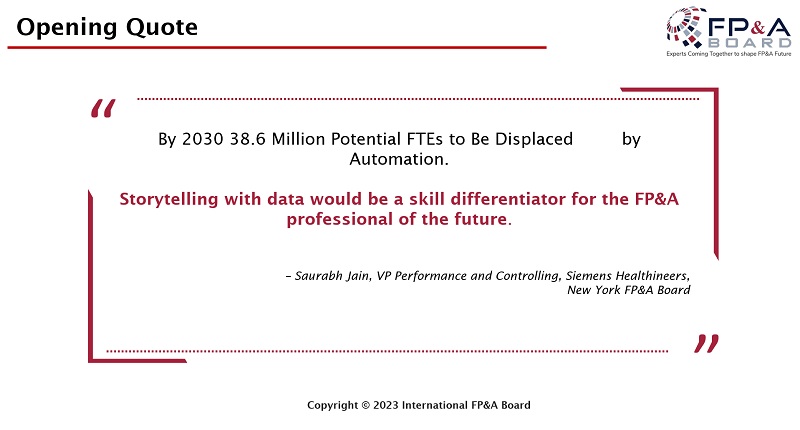
Figure 2
While storytelling may become a skill differentiator for FP&A professionals, recent FP&A Trends Survey results show that only 33% of the time is spent on storytelling with data. This represented a slight fall from 35% in 2021 for over 330 respondents.
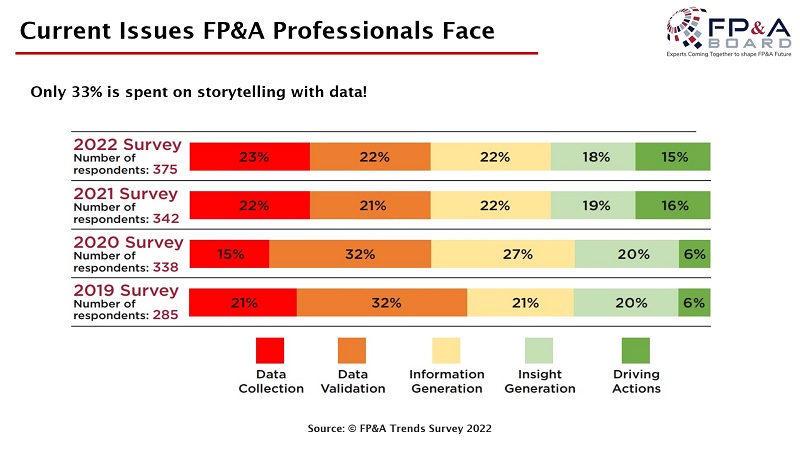
Figure 3
Three Building Blocks of FP&A Storytelling
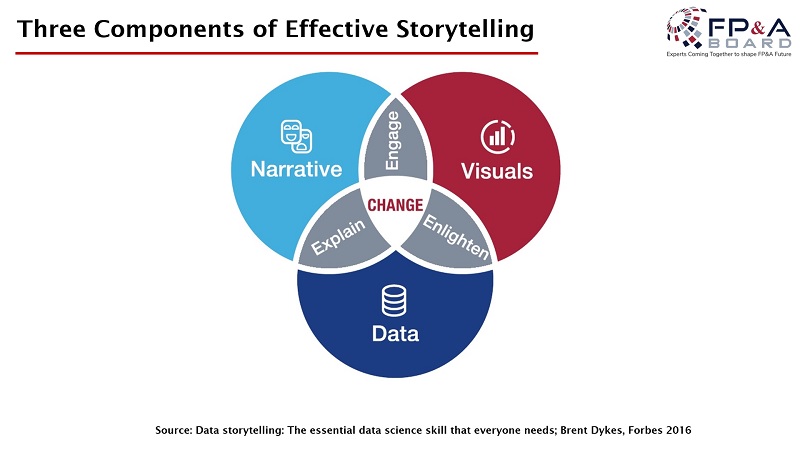
Figure 4
At the meeting, we dived into three building blocks of FP&A Storytelling:
- Data.
- Narrative.
- Visuals.
Building the Narrative
The Board discussed how FP&A Storytelling could bring numbers to life and focused on the importance of the narrative.
This included capturing the following:
- Use brief bullet points.
- Step into the shoes of the audience.
- Know your audience's agenda and the purpose of the presentation.
- Consider the questions "Where" and "How": does the presentation need to be adapted based on the meeting format, e.g. whether it is in person or virtual?
The narrative should also consider an emotional appeal, e.g. how you want the audience to perceive you. The participants shared the importance of socialising with key stakeholders before presenting bad news so they don't hear about this for the first time in a formal forum.
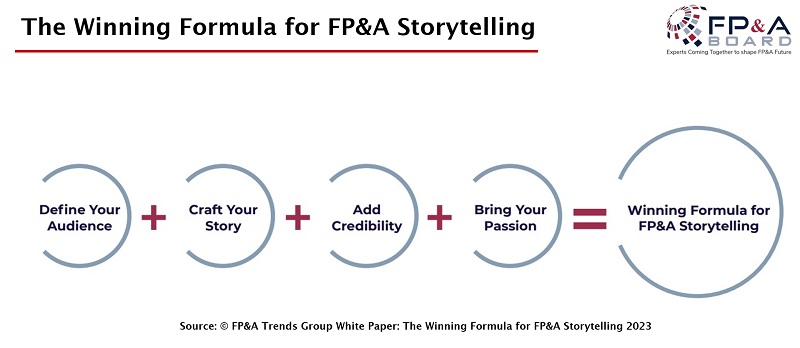
Figure 5
The forum highlighted the importance of collaboration with stakeholders when crafting the story. This is especially important when the FP&A team preparing the materials may not be presenting them. For example, the CFO may lead the presentation for investor meetings, and, therefore, they must be engaged throughout the process. Iterative reviews and edits may be necessary to ensure the key messages crafted are appropriate to the end audience.
To add credibility, the FP&A Board members highlighted that the output should be:
- Supported by financial data.
- Corroborated by external research or operational data in other parts of the organisation.
- Authentic and honest, with consistency in delivery and trust built over time.
The Board further discussed how to tailor the FP&A Story to your audience:
- For global organisations, in particular, cultural differences and the diversity of the audience in different parts of the world would need to be considered. The challenge is how the message can cut through to each person equally.
- When stakeholders are in a meeting, they may prioritise and focus on different aspects of the presentation. For example, the CFO may look at data differently than the Head of Strategy. When presenting the story, it is important to hold onto the key message and agenda and the key decision or outcome that needs to be made from the meeting. Being mindful not to be swayed or distracted by different topics is also critical.
Visualising the Data
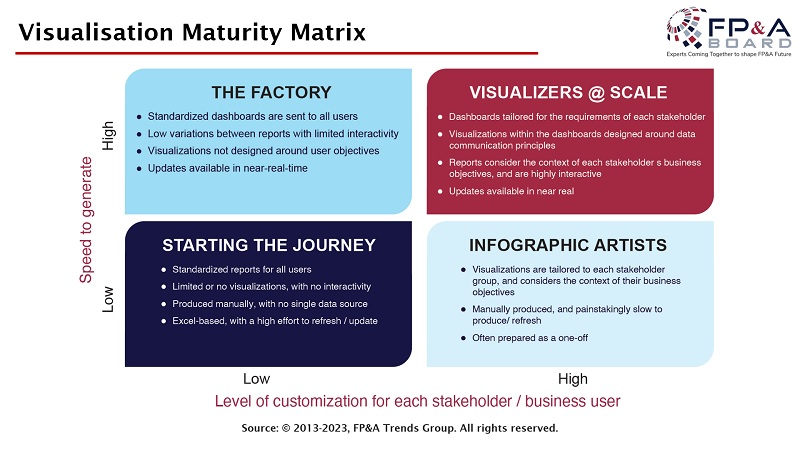
Figure 6
FP&A Trends Group have identified these categories of visualisation maturity. Their specifics are briefly outlined in the figure above. After assessing where you are on this scale, you will have to choose between two options to move to the next level. These options are either to improve your FP&A storytelling skills or technology. The forum had an opportunity to listen to practical insights about storytelling with data.
Alex Sashenkov, Head of Commercial Finance at AkzoNobel, presented his practical experience on the subject. He reflected on the challenges in delivering the monthly performance review to different audiences with different backgrounds and experiences and explored how our cognitive abilities learn and process new information.
The sensory memory sees and hears the various inputs from the environment. This is then selected for attention by the working memory, which has a limited processing capacity. When a lot of text, data and visuals are presented, the message cannot be conveyed clearly as the working memory goes into cognitive overload and cannot process the information.

Figure 7
Alex suggested we tend to prefer reading over listening. When a slide is presented with much text, we will try to read it while listening to the presenter. It can often result in confusion. Although the presenter may have much experience and put much work into preparing the analysis and presentation, the audience cannot digest it easily. Remembering that the presenter is already familiar with the material and underlying data is important. The audience may be seeing the information for the first time. If the presentation contains too much information, the audience may be unable to filter out the key points easily.
In highlighting this blind spot, Alex shared some suggestions on how information can be presented:
- The Signalling Effect is about directing attention to key information with the help of visuals, e.g. with different colours, arrows or bubbles on the slide, or physically, i.e., by pointing or calling it out.
- The Coherence Effect supposes removing any irrelevant information from the presentation. For example, we can focus on a table or use a chart on the key metrics only without the ancillary data.
- The Modality Effect leverages visual and auditory processors of working memory. For example, we can supplement the text with charts showing the shape or trend of data or highlight any anomalies or exceptions.
In addition, Alex shared a few other techniques that might be useful when presenting complex information:
- Sequencing Effect – introduce the whole picture before splitting out the parts that lead back to a summary of the whole.
- Pre-Teaching Effect – share some of the knowledge before the main presentation.
- Segmentation Effect – break the learning into bite-size pieces spread over time.
- Variation Effect – Illustrate the same concept with many examples.
- Expertise Reversal Effect – match content complexity to the level of understanding.
Data and Technology
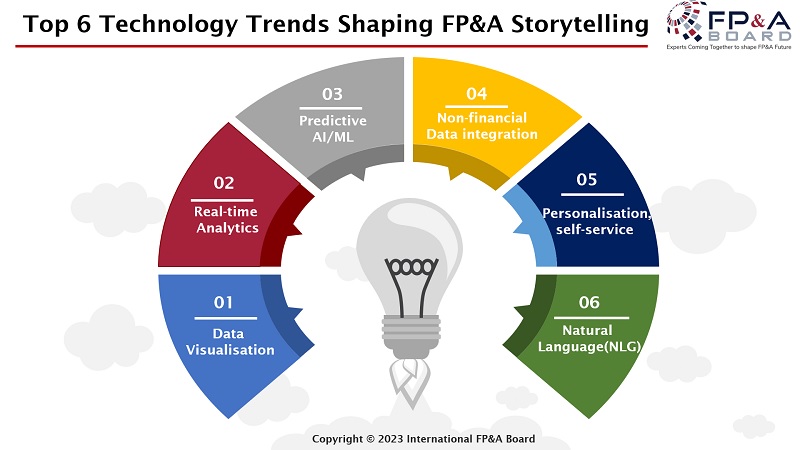
Figure 8
The International FP&A Board identified the top six technology trends shaping FP&A Storytelling, outlined in the picture above.
The London FP&A Board Members also discussed the role of data in FP&A.
Martin Watson, Strategic Account Director at CCH Tagetik, highlighted the sense of burden and opportunity that finance leaders feel when they think about data. It is the burden of managing an ever-increasing volume and variety of data (internal and external); and the potential insights and actions that we all know data can unlock if we manage it well.
Martin explained that many technologies help leaders gain confidence and insight into their data (and the huge advances in data/performance management in the past five years). He also suggested that the first step is to pause and understand these capabilities before getting too excited or afraid of technology.
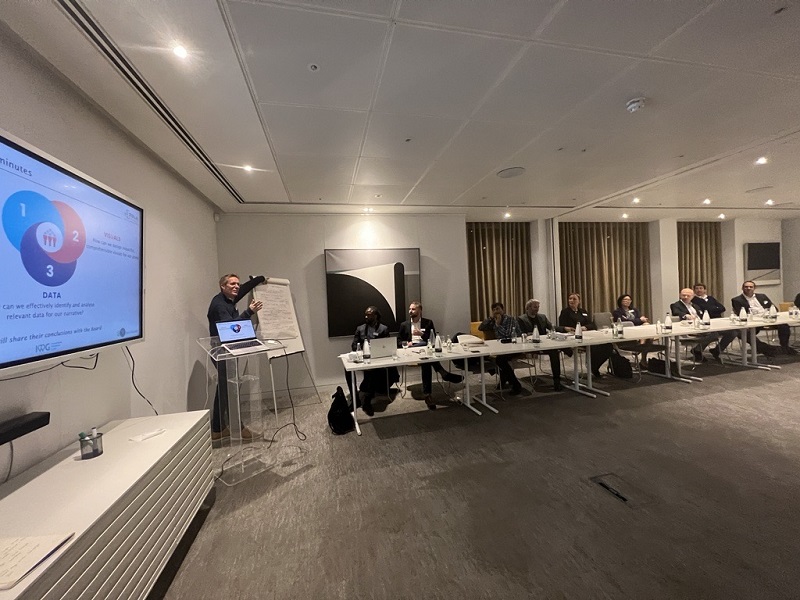
Figure 9
Martin led the break-out group discussion on Data and shared the key points raised by the group on how to identify and analyse relevant data for the narrative effectively:
- Start by clearly defining the data question you are trying to answer - don't get lost in all the clever things you could do, and don't be side-tracked by data gaps/frustrations.
- Determine the top 3 KPIs and how they support the strategic business objectives. This should be applied consistently from the top down and aligned in measurement.
- Determine where the data comes from and if it is right. Does the data come only from Finance, or does it require collaboration with other teams to pull it together?
Conclusion
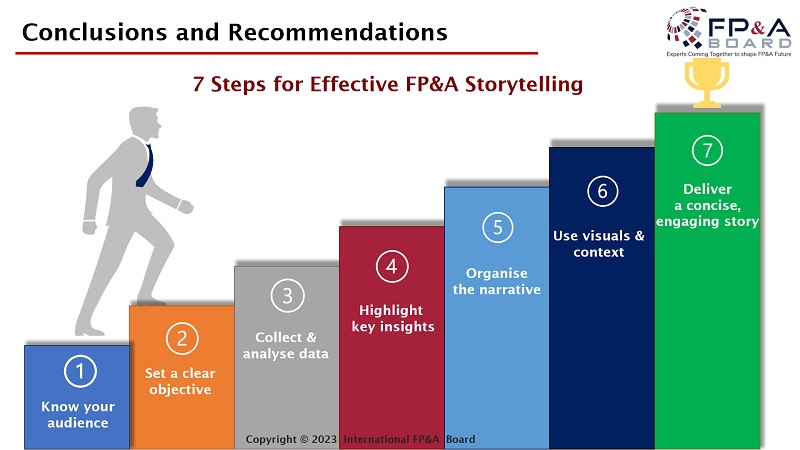
Figure 10
Through extended practical discussion, the attendees figured out the key steps for effective FP&A storytelling that involve:
- Know your audience and define the objectives of the presentation or report. Especially if the deliverable is to cater for multiple stakeholders, the appropriate outcome or decision needs to be prioritised and customised for each group of stakeholders (if necessary).
- Collect and analyse relevant data to bring insight and add credibility.
- Avoid cognitive overload by stripping out irrelevant data. Add straplines to highlight key points.
- Craft the story through a clear and flowing narrative supported by visualisation tools. Focus on the required actions, e.g. use visual aids to present sensitivity analysis to observe the different outcomes from different options.
- Ensure relevance by ongoing engagement and collaboration with other teams and stakeholders, especially if the narrative is intended for an external audience, e.g. investors.
Subscribe to
FP&A Trends Digest

We will regularly update you on the latest trends and developments in FP&A. Take the opportunity to have articles written by finance thought leaders delivered directly to your inbox; watch compelling webinars; connect with like-minded professionals; and become a part of our global community.


