In this series of blogs, based on the recent webinar “XP&A in action: Enhancing FP&A Agility with...

Introduction
To identify new opportunities and risks and stay ahead of the competition in terms of market share, financial growth and sustainability, we need to understand business analytics trends that will shape demand, consumer spending and the company's financial performance. By evaluating the correlation between demand data and key economic performance indicators, we can provide a context on the historical and future performance of the business and how it fits in with the broader economic environment.
To achieve better results, we need to set up a planning process with the participation of all commercial and supply chain departments, followed by implementing Extended Planning and Analysis (xP&A).
This article overviews what FP&A professionals can do to optimise the business they are working in and safeguard the budget plans within the organisation.
How Can We Safeguard Our Budget Plans?
The overall financial performance is determined by the end of the actual process (month-end closing). The organisation works on day-to-day operations, and the results are determined at the end of the period. Any "surprises" that affect the financial results cannot be adjusted after the closing period, and the management team, as agents of shareholders, cannot make decisions that secure budget plans for actual data.
In addition, companies often spend plenty of time developing budget plans, but by the time they are finished, the market has changed, and the budget has become obsolete. Instead of being once-a-year exercises, we need predictive processes to happen regularly.
Rolling Forecasts through the monthly business planning process and variance analysis, especially in contrast to the budget and previous cycle estimates, can help us identify all risks and opportunities, minimise financial risks, and safeguard full-year budget plans.
Business Planning Process Using Monthly Rolling Forecasts
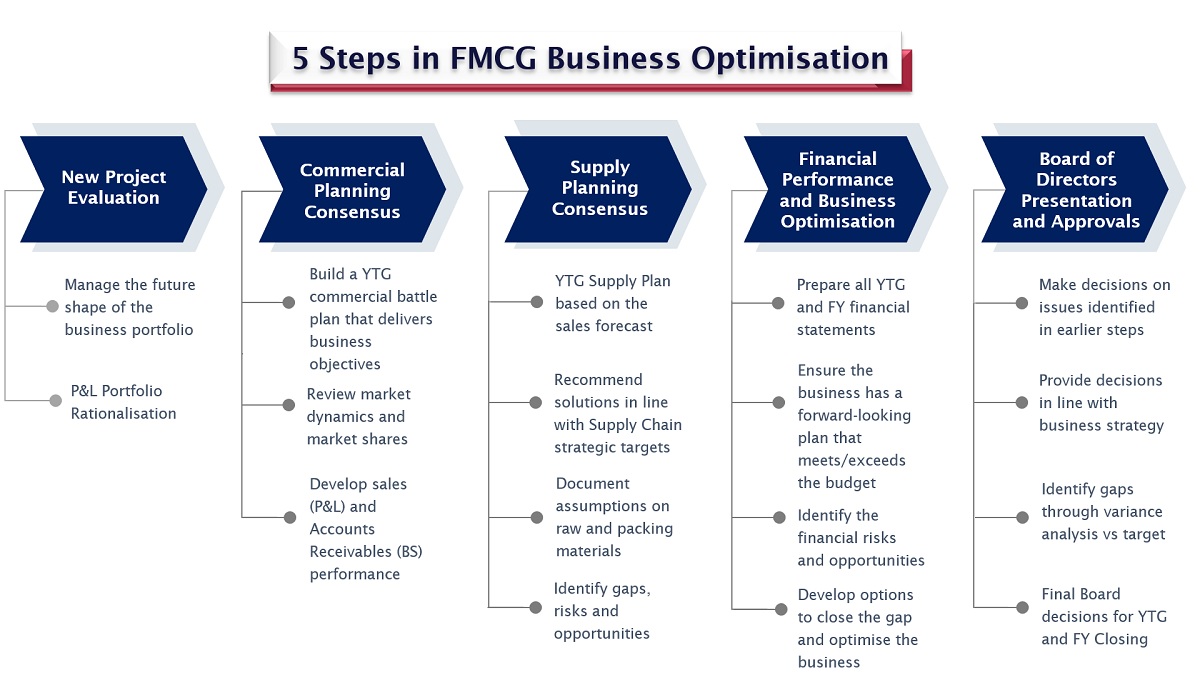
The business planning process consists of five overall steps, illustrated below. It may be likened to railway train lines where the train transfers the passengers to their destination. In my opinion, this process is a tool to determine the financial results for the balance-to-go period and FY Closing.
Cost centre owners can estimate Pricing and Consumer Trade spending plans, Expenses and Overheads, Purchase Prices and Factory Production rates on a rolling basis for the year-to-go (YTG) period and based on actual year-to-date (YTD) results before the end of the closing period.
If we know about the risk or opportunity, we need to pass it on in our financial statements through the above process. It is essential to turn Product Stock Keeping Unit (SKU) and customer analysis to have a competitive advantage and increase Demand Forecast Accuracy.
Volume is the key driver in the Food and beverages FMCG industry. Accurate demand forecasts from commercial departments could help retail and supply chain profit centres optimise sales forecasts, commercial plans, stock levels, production schedules or inventory management while minimising costs and maximising profits. So, all departments need unbiased inputs/outputs to run the S&OP process.
On the one side, a commercial profit centre generates profits through prices, commercial trade, marketing investment and demand volume. Commercial teams such as Marketing, Trade Marketing and Sales are responsible for estimating these P&L measures, considering the market shares and the company's commercial strategy.
On the other side, the supply chain profit centre generates profits through material and packing costs, carriage, conversion costs and overhead optimisation. Supply chain teams such as Supply Planning, Procurement and Production Planning and Scheduling are responsible for fulfilling the demand volume submitted by commercial teams, estimating purchase prices and factory rates such as labour and electricity.
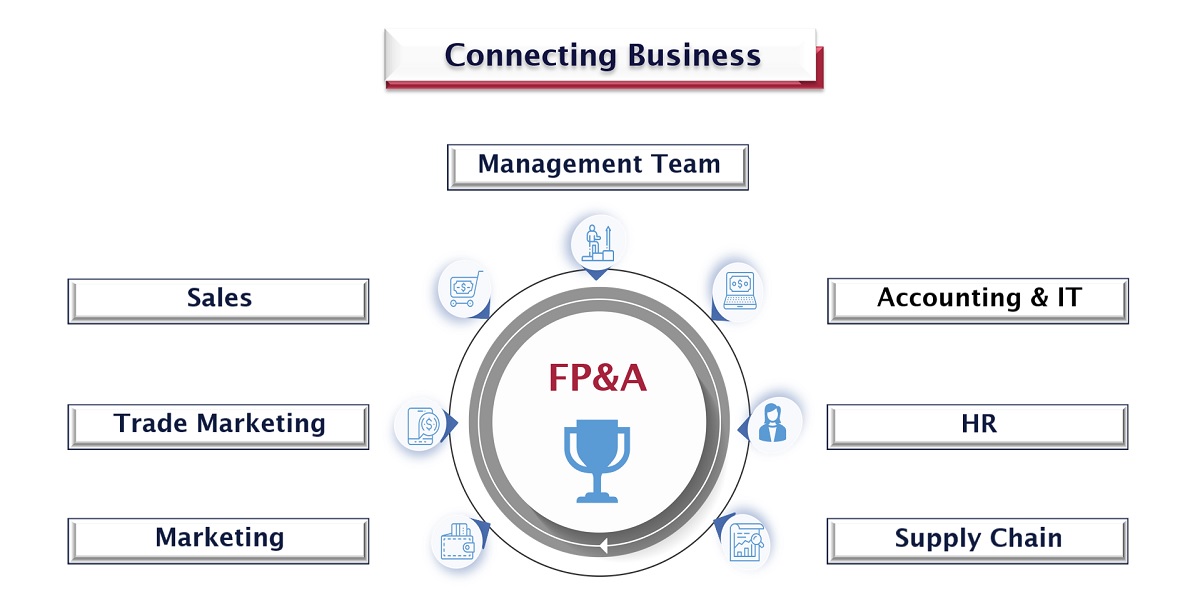
In the FMCG industry, FP&A professional is the key Business Partner to all commercial and supply chain teams. They help provide actionable insights, valuable analytics, and support sound decision-making, all of which contribute to achieving the company's financial goals.
Connecting commercial and supply chain inputs and outputs with financial statements is the fundamental responsibility of an FP&A professional. And they can do this through a strategic monthly rolling business planning process.
As agreed by the management team, all actions from the current planning cycle should be included in the next cycle. FMCG FP&A practitioners should assess the numbers and trends using Predictive Analytics and reach conclusions based on the findings in Step 4 below, “Financial Performance and Business Optimisation”. The outcomes help identify patterns in this data correlating historical performance with management team actions.

Figure 1
Business Optimisation Process Tips
The definition of business optimisation includes two phrases:
- a) most effective practices and
- b) the best alternative.
Its direct benefits include increased profitability, improved productivity, lower costs, and targeted Pricing & Promotion Policies. In addition, the development of a culture of excellence and the elimination of organisation silos that impede business operations can lead to greater organisational focus.
In the FMCG industry, there are two main optimisation areas.
-
Pricing & Commercial Promotion Optimisation
The key challenge in the FMCG industry is increasing not only your market shares but profits. How can we reach specific profit levels with the most appropriate "commercial paths" such as volume, discounts and prices? Using the Rolling Forecasts process to identify multiple what-if scenarios helps develop more profitable commercial plan practices and Targeted Effective Spending. This is the meaning of Predictive Business Finance Analytics.
Key takeaway: The FP&A team should move from monitoring to determining business finance measures and minimise profit "surprises" in actual results.
-
Procurement & Supply Optimisation
We focused on strong collaboration with Supply Chain using financial models and “what-if” scenarios. You can evaluate P&Ls with projected raw-packing material prices and factory performance rates, proposing updated prices and commercial plans. Focus on proposing specific commercial discounts per Customer/SKU for increasing sales and production volumes (cash margin compared to general margin percentage scenarios). The key question is how to optimise production volumes and conversion costs in economies of scale.
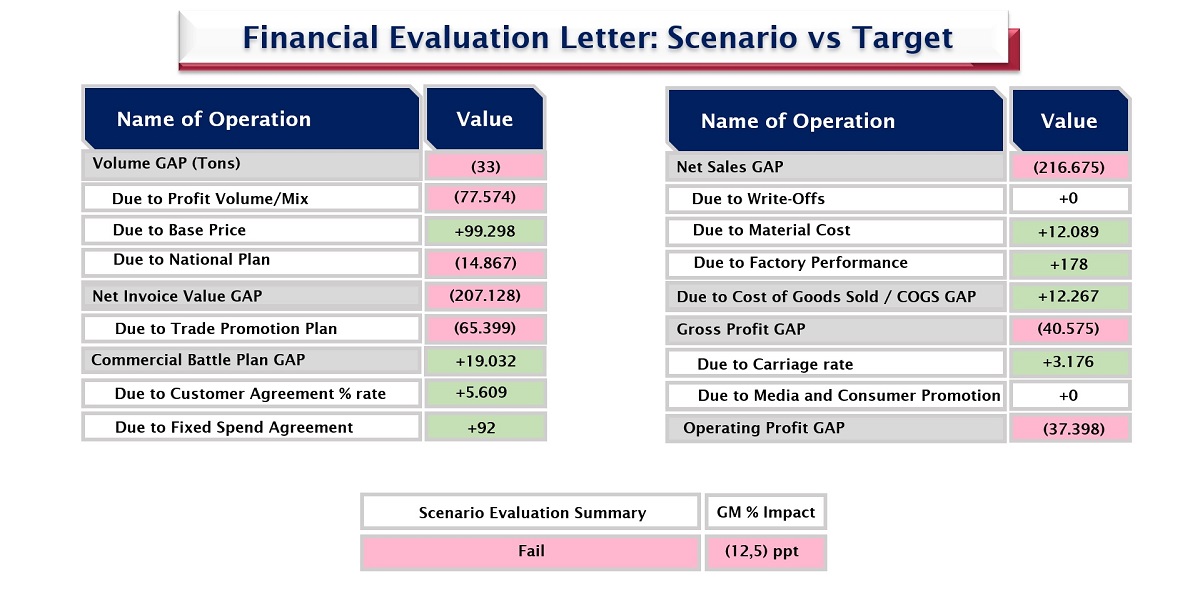
Optimisation Methods Using What-If Scenarios and Bridge P&L Variance Analysis

Figure 2
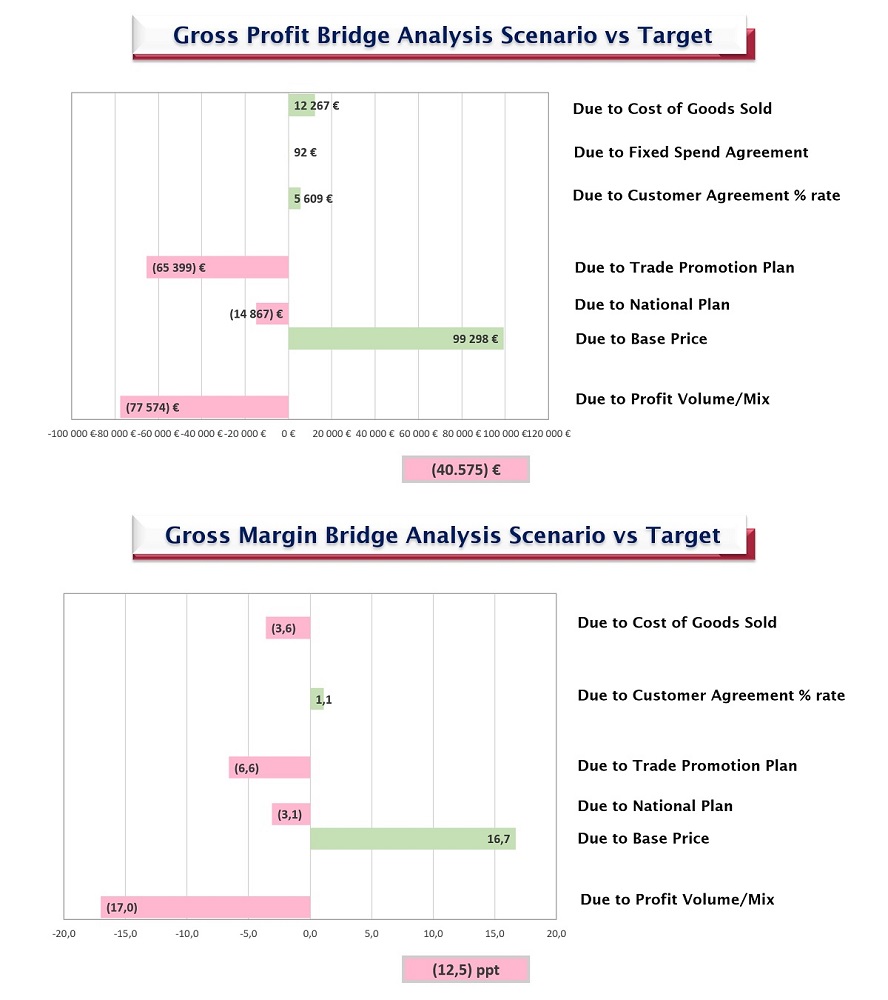
My favourite analysis tool in what-if scenarios is the bridge variance analysis. The effort in determining the numeric deviations and defining the financial gaps between new scenarios and budget levels, coded as “Target” in the picture below, is a great exercise for the FP&A team.

Figure 3
The scenario modelling is applied for all dimensions (P&L lines - market - customer/Product SKU and period) using new assumptions versus the Budget Plan, explaining to the management team which P&L line is affected by the new proposal.
The scenario evaluation in terms of cash profit and margin percentage can be seen by the P&L line movements/gaps. It helps to educate the team in cause-and-effect relationships, making the entire P&L more visible and understandable.
Conclusion

Figure 4
Ultimately, an FP&A professional should adopt several main practices that may help safeguard and optimise corporate and financial objectives:
- Gather, structure, and use data efficiently during the business planning process;
- Focus more on optimising business performance instead of monitoring it;
- Become a good Business Partner to allow sound decision-making.
Subscribe to
FP&A Trends Digest

We will regularly update you on the latest trends and developments in FP&A. Take the opportunity to have articles written by finance thought leaders delivered directly to your inbox; watch compelling webinars; connect with like-minded professionals; and become a part of our global community.


