
Financial model definitions can be tricky. Financial models are often dependent upon numerous functional areas and...

Sensitivities, Scenarios, What-if Analysis – What’s the Difference?
November 22, 2019
 Scenario analysis, sensitivity analysis and what-if analysis are very similar concepts and are really only slight variations of the same thing. All are very important components of financial modelling – in fact, being able to run sensitivities, scenarios and what-if analysis is often the whole reason the model was built in the first place.
So what’s the difference?
Let’s start with the definitions. In a financial modelling context, a sensitivity analysis refers to the process of tweaking just one key input or driver in a financial model and seeing how sensitive the model is to the change in that variable. Scenarios, on the other hand, involve listing a whole series of inputs and changing the value of each input for each scenario. For example, a worst-case scenario could include interest rates increasing, number of new customers being less than expected, and unfavourable exchange rates and all these things happening at the same time. What-if analysis refers to answering the question “what-if we did this?” or “what-if we did that?” which can be answered by running scenarios and sensitivities. This can be done by running pre-set scenarios or by testing sensitivities by changing the inputs either manually or using data tables. Some of the tools, such as data tables that we can use for performing what-if analysis are found on the tab in Excel helpfully labelled “What-if analysis” as shown in Figure 1. So what-if analysis is a general term which may refer to performing either sensitivities or scenarios, or both.
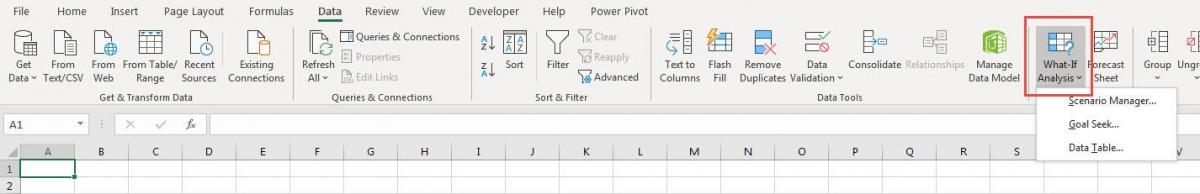
Figure 1: What-if Analysis tools in Excel
Why run scenarios and sensitivities?
Scenarios and sensitivity analysis are a great way to insulate your model from risk by seeing all the possible outcomes of the project or venture you are modelling. What would be the absolute worst that could happen? If everything that can go wrong does go wrong, can we still afford to pay staff? There are usually interdependent effects and interactions between multiple variables which may change in the model, and this is why it’s so important to have links automatically calculating within a model. For example, if units sold increases, then revenue increases, so profitability increases, so cash flow increases, so borrowing decreases, so interest payable decreases and so on…. With a well-built model which has all inputs linked to outputs, it is relatively easy to change inputs and watch the outputs change. In fact – this is pretty much the whole point of financial modelling!
Scenarios can assist with decision analysis. They are laid out in advance so that the decision makers can see the expected impact of each course of action. How close to reality these scenarios really depend on the accuracy of the assumptions implicit in the model – but that’s another story!
Which assumptions should be changed in each scenario?
To have the greatest impact, scenarios should really focus around the area or assumption around which we have the least certainty, or for which fluctuations would materially impact the business. For example, Figure 2 shows one of the models for working out factory production profitability and cashflow funding. The way that this model has been laid out, all possible inputs could change, however, we have only changed some inputs under each scenario and in some cases, the input does not change at all if the change is not considered likely, or something that will materially impact the business. In this example, annual production capacity in row 4 is a pre-determined input not deemed likely to change under any scenario.
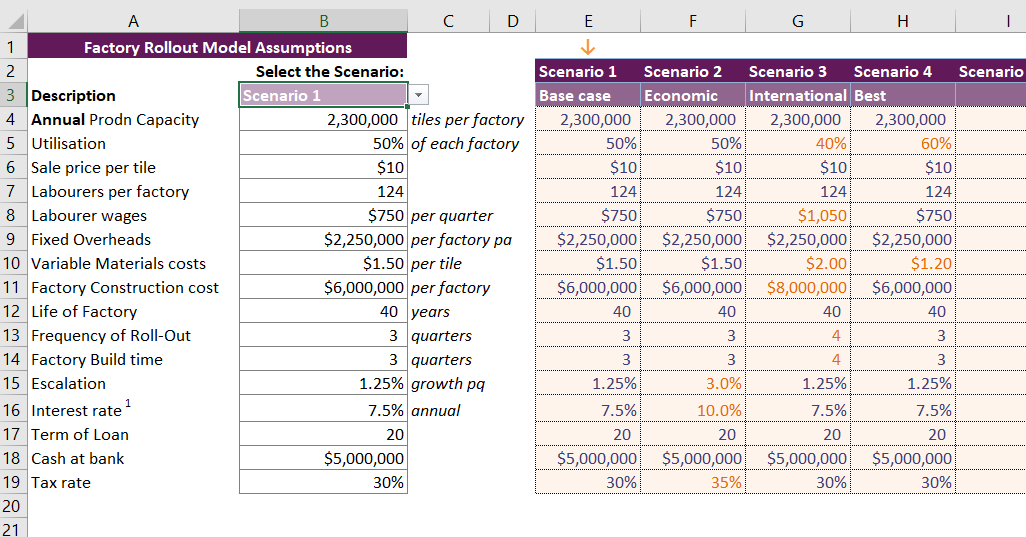
Figure 2: Example of Scenario Layout
In this simple example, the entire model is built based on the inputs in column B and cell B3 is selected by the user to display the scenarios. Column B contains formulas of course which will dynamically display the inputs picked up from the scenario table for the selected scenario.
How many scenarios should a model contain?
I’m often asked how many scenarios should be in a model and it really depends on the amount of time and the degree of detail and certainty that is required for the model. At minimum, a model should contain at least three scenarios such as Best case, Base case and Worst case. I have seen models with around fifty scenarios modelled, but it does become rather unwieldy and confusing so unless you really need them, I’d probably recommend sticking to around twelve scenarios.
What are the best tools for modelling scenario and sensitivity in Excel?
To summarise, there are many ways to create scenarios and run sensitivity analysis in Excel:
- Manual Scenario selection (Switches or Drop-downs) is the most commonly used method (and the first one that I teach in my courses) uses a combination of formulas and drop-down boxes as shown in Figure 2 above and is the easiest to build and understand. If the model has been well-built, and all the inputs are flowing through to the outputs, then the results of the model will change as the user selects different options from the drop-down box. Bear in mind that you cannot easily view scenarios side by side using this method.
- Data Tables are incredibly powerful and best for running sensitivity analysis as shown in figure 3 below when you have a single output and one or two inputs. If you need to be able to see the outputs of your sensitivities analysis side-by-side, and if you’ve only got one or two inputs then consider using a data table.
- Goal Seek is useful for what-if analysis if you have a formula, a hard-coded number that drives the formula and if you know the result the formula should show. It’s particularly useful for running breakeven analysis; for example, how many customers do I need in order for profit to be zero?
- Scenario Manager is pretty basic, and not particularly useful for a reasonably advanced Financial Modeller. It has pride of place on the “What-if Analysis” tab in Excel right above the Goal Seek and Data Tables as shown in figure 1 but is nowhere near as useful.
- Monte Carlo (Stochastic Simulations) which tests thousands of tiny variations in scenarios, is normally performed using third-party software although it is possible to do a rudimentary version of it in Excel using data tables.
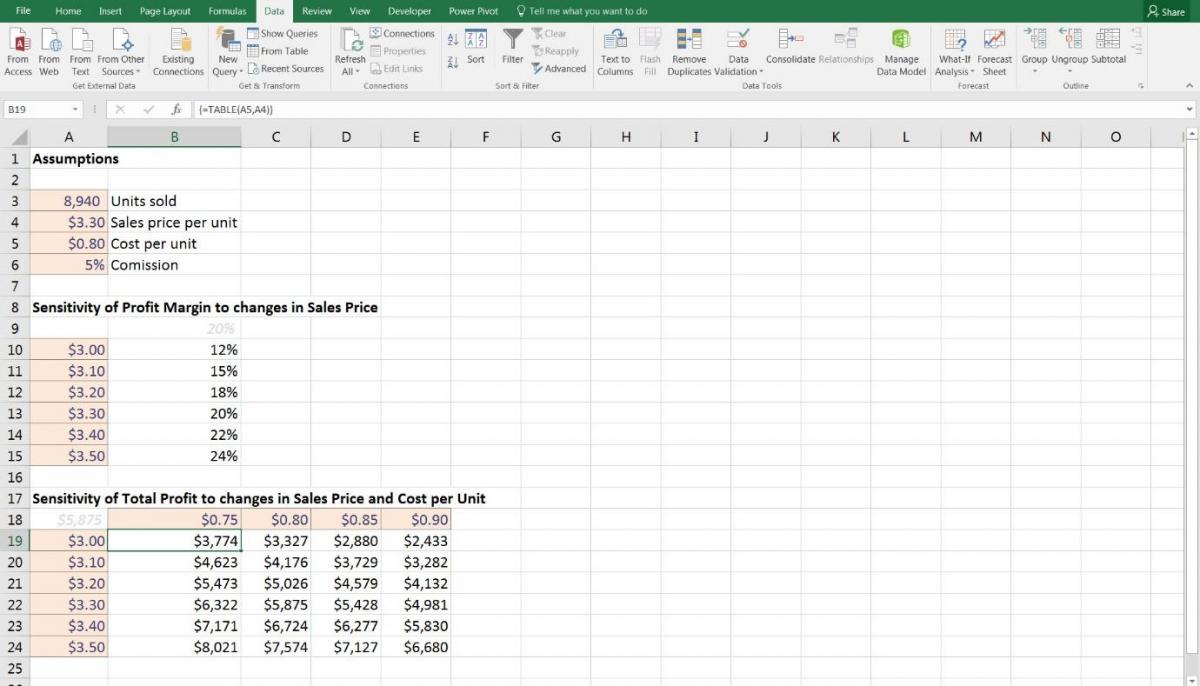
Figure 3: One-input and Two-Input Data Tables [1]
[1] Image sourced from “Financial Modelling in Excel for Dummies”, Danielle Stein Fairhurst, John Wiley & Sons, 2017, Chapter 8, Figure 8.1
The full text is available for registered users. Please register to view the rest of the article.
Related articles

During the recent years, the level of detail and precision which financial modeling in the business...

Although there are some substantial differences between Financial Modelling and Predictive Analytics, both help us cope...

Disclaimer: Financial Modelling has no strict “right” or “wrong” method of application. It does, however, have...

Spreadsheets are without doubt the ‘killer’ application that turned the PC into an indispensable business tool...

Most recently, I have been observing significant changes in business models in many organisations around the...
+
Subscribe to
FP&A Trends Digest
We will regularly update you on the latest trends and developments in FP&A. Take the opportunity to have articles written by finance thought leaders delivered directly to your inbox; watch compelling webinars; connect with like-minded professionals; and become a part of our global community.
Giuseppe Capoderose
May 16, 2020
Ikedikings
June 8, 2020