In this series of articles, we delve deeper into the importance of finding the right balance...
The previous article delved into Zone to Win as a strategic decision-making framework for balancing growth and profitability. In this article, we’ll look at how organisations can use the Balanced Scorecard to strike a balance between growth and profitability. As context-setting, Zone to Win divides operations into zones according to their attributes. In contrast, the Balanced Scorecard (BSC) stresses the significance of using both non-monetary and financial performance indicators in a balanced manner.
Understanding the Balanced Scorecard (BSC) Framework

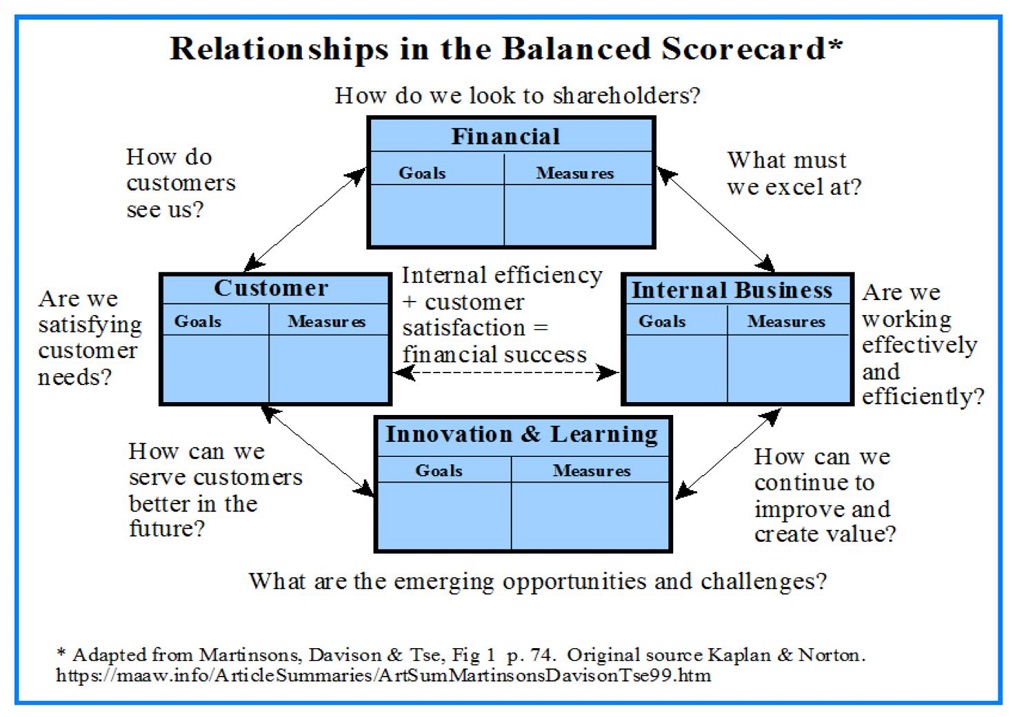
Figure 1: The Balanced Scorecard (BSC)1
Introduced by David Norton and Dr Robert Kaplan in 1992, the Balanced Scorecard (BSC) is a strategic performance management tool that has since become a widely adopted framework for enterprises seeking to enhance their decision-making process. Originally published as a Harvard Business Review article, the Balanced Scorecard gained popularity in the USA, Europe, and Asia for its ability to provide a comprehensive view of an organisation's performance beyond traditional financial measures.
Why Is the Balanced Scorecard Used for Decision-Making?
The Balanced Scorecard framework serves as a powerful tool to translate a company's vision and strategy into a coherent set of balanced performance indicators across four key perspectives: Financial, Customer, Internal Processes, and Learning and Growth.
-
Financial
This aspect of the BSC is arguably the most conventional as it emphasises the company’s financial success metrics. Providing financial perspective through Earnings, Margins of Profitability, ROI, and Funding aids executives in making well-informed decisions. Through the examination of each of the financial metrics, management can discern how their choices affect profitability.
-
Customer
The customer viewpoint highlights the significance of providing consumers with value. It helps management make choices that improve consumer retention and happiness. Client satisfaction increases the likelihood that an organisation will receive loyal customers, improving the company's sustainable profitability2.
-
Internal Business
This viewpoint concentrates on the internal procedures and undertakings that propel the generation of value within the company. Organisational management can use this viewpoint to pinpoint instances where process enhancements can result in improved revenue and effectiveness of operations. Process-related KPIs, which include cycle times, percentages of defects, and levels of efficiency, can be analysed to identify bottlenecks, simplify procedures, cut expenses, and preserve or even raise the calibre of goods and services3.
-
Innovation and Learning
This viewpoint focuses on how well a business can innovate, adapt, and acquire new information and abilities. Executives may ensure their company is ready to sustainably promote growth by tracking metrics like staff training, skill development, and innovation projects. Motivated and competent workers are more inclined to spur innovation, which can result in new sources of income and higher profitability.
This comprehensive approach makes it an excellent choice for strategic decision-making, owing to the following factors:
1. Comprehensive Performance Measurement: The Balanced Scorecard tracks diverse metrics – financial, customer, internal processes, and learning and growth, offering a holistic view for well-informed decisions.
2. Alignment with Strategic Objectives: The framework aligns operational activities with long-term objectives, ensuring a focused and coordinated approach.
3. Communication and Collaboration: The Balanced Scorecard fosters cross-functional collaboration by providing a common framework and indicators.
4. Data-Driven Decision-Making: Regular analysis of performance data empowers evidence-based, proactive decisions.
5. Continuous Performance Improvement: Monitoring against targets drives iterative decision-making for enhanced efficiency and effectiveness.
How To Use the Balanced Scorecard in Balancing Growth and Profitability?
Organisations can leverage the Balanced Scorecard to make informed decisions and achieve a harmonious balance between growth and profitability.
1. Prioritise Zones within the Scorecard
Businesses can assign different priorities to the four perspectives of the Balanced Scorecard based on their strategic goals. For instance, if the primary objective is rapid growth, the organisation might emphasise the Customer and Learning and Growth perspectives, allocating more resources to market expansion and product development.
2. Dynamic Resource Allocation
Implement dynamic resource allocation based on performance results and market conditions. Regularly review and adjust resource distribution between growth and profitability initiatives to respond to changing opportunities and challenges. This flexibility ensures that the company can seize growth opportunities when they arise while maintaining profitability in stable markets.
3. Scenario Planning
Utilise Scenario Planning techniques to model different growth and profitability scenarios based on the Balanced Scorecard perspectives. Decision-makers can identify potential trade-offs between growth and profitability by examining various scenarios, which allows them to make informed decisions that achieve an optimal balance.
4. Performance Trade-Offs
Recognise that there may be certain trade-offs between growth and profitability. For instance, rapid expansion might initially impact short-term profitability due to higher investments, but it could lead to greater long-term profitability. Decision-makers can use the Balanced Scorecard to evaluate and quantify these trade-offs. This framework can help guide them in striking the right balance between the two metrics.
5. Innovation and Efficiency Synergy
Look for synergies between growth initiatives and efficiency improvements. For example, investing in process innovation might lead to cost savings, which can be redirected towards growth-focused activities. By identifying such synergies, the organisation can optimise the use of resources to achieve growth and profitability objectives simultaneously.
Therefore, BSC gives decision-makers a comprehensive picture of the business's performance by considering internal procedures, consumer satisfaction, growth and development, and financial data. With this holistic viewpoint, executives may make well-informed decisions that promote profitability and growth. The BSC, for instance, can be used by a manager thinking about entering an unfamiliar market to evaluate how the move will affect internal procedures, client happiness, and the business's ability to adapt and facilitate meaningful growth. Companies and executives can balance immediate benefits with long-term viability by meticulously weighing these aspects, resulting in a more profitable and healthier firm4.
Practical Examples of Companies That Have Already Implemented Balanced Scorecard (BSC)
1. Samsung
Samsung's multinational technological company adopted the BSC to oversee its business units and improve choice-making. By considering different viewpoints, Samsung's mobile division, for example, utilised this framework to balance growth and profitability. The firm monitored market share and client fulfilment to gain insight into the financial perspective. As a result, they streamlined the distribution network and manufacturing procedures to gain insight into the customer perspective5.
2. General Electric (GE)
Another well-known global enterprise that uses the BSC to inform its strategic choices is GE. GE used the BSC framework to oversee various operations, such as energy and aviation. From a financial standpoint, GE monitored important financial indicators like cash flow, profitability, and revenues. General Electric calculated every corporation unit's market share and satisfaction with consumers from the standpoint of the customer. GE optimised its production and operating procedures by adopting an internal processes approach, which resulted in lower costs and higher-quality products6.
3. Walmart
Global retailer Walmart has successfully incorporated the BSC into its decision-making procedures to balance growth and profitability. Walmart monitors financial performance metrics like sales income, profit margins, and ROI from a financial standpoint. Walmart relies heavily on consumer feedback since it uses loyalty schemes and polls to track consumer fulfilment and loyalty. Operating excellence, inventory control, and supply chain effectiveness are the main topics of discussion from the standpoint of internal procedures7.
Conclusion
In conclusion, business executives can come up with balanced choices that support profitability and expansion with the help of the BSC tool, which provides them with an extensive array of performance indicators and viewpoints. This method contributes to the company's continued growth and longevity by promoting a strategic attitude that extends beyond immediate financial benefit.
References:
- MARTINSONS, M., DAVISON, R., TSE, D. "The balanced scorecard: A foundation for the strategic management of information systems." Decision Support Systems (25): 71-88. Managing and Accounting Web (maaw.info). https://maaw.info/ArticleSummaries/ArtSumMartinsonsDavisonTse99.htm
- TIBBS, C. Y., LANGAT, L. K. "Internal process, learning perspective of balance scorecard and organizational performance." 2016.
- KOLUMBER, Š., & TKAČIKOVÁ, L. "Measuring Company Performance by Using the Balance Scorecard Concept." International Days of Science, 12-13. 2020.
- MARTINI, L. K. B., & SUARDANA, I. B. R. "Company performance measurement applying a balanced scorecard approach." International Journal of Social Sciences and Humanities, 3(1), 7-13. 2019.
- LawAspect.com. "Balanced Scorecard Study - Samsung - Law Essays." 2020. Accessed December 19, 2023. https://lawaspect.com/balanced-scorecard-study-samsung/
- IvyPanda. "General Electric Company's Organizational Strategy." August 1, 2020. Accessed December 19, 2023. https://ivypanda.com/essays/general-electric-companys-organizational-strategy/
- IvyPanda. "Walmart Balanced Scorecard – a Case Study." October 30, 2023. Accessed December 19, 2023. https://ivypanda.com/essays/balanced-scorecard-for-walmart-company/
Subscribe to
FP&A Trends Digest

We will regularly update you on the latest trends and developments in FP&A. Take the opportunity to have articles written by finance thought leaders delivered directly to your inbox; watch compelling webinars; connect with like-minded professionals; and become a part of our global community.


