
In this article, discover how Agentic AI is revolutionising FP&A by automating forecasting, budgeting, and variance...

The Forecasting Shift: From Excel to AI-Driven Precision
July 24, 2025

Forecasting Enters the AI Age
In boardrooms and FP&A departments, a quiet revolution is underway. Finance teams long-reliant on Excel-based forecasting have switched to or are increasingly experimenting with AI-driven predictive models to navigate today’s volatile business climate.
The value proposition is compelling: faster cycles, deeper insights and more precise forecasts derived from vast internal and external data. Gartner forecasts that by 2028, 50% of organisations will use AI to replace “time-consuming bottom-up forecasting approaches” [1].
Yet adopting AI-based forecasting isn’t a mere plug-and-play upgrade; it’s a paradigm shift in how finance works. FP&A teams must first understand how Predictive Forecasting today expands beyond Excel’s assumptions. Traditional Excel forecasts are typically linear, manually built and scenario-based. They are heavily reliant on assumptions and limited historical data.
In contrast, AI-powered models learn patterns from vast, often external datasets and update forecasts continuously based on changing inputs. This moves forecasting from static planning to dynamic, data-driven insight. CFOs, as sponsors of these transformations, must grasp how these approaches differ and where each excels.
In this article, we clarify those differences – from Excel vs. predictive methods to forecasting vs. classification models and from univariate to multivariate series techniques, all grounded in real-world finance examples and implementation trade-offs. The goal is to help finance leaders understand the key differences between traditional and modern forecasting methods, so they can confidently explore new tools.
From Static Spreadsheets to Dynamic Predictions
For decades, CFOs and FP&A teams relied on Excel models: labour-intensive tools built on assumptions and intuition. These approaches are slow, narrow in scope and prone to error.
Today, a shift is underway. Predictive forecasting now leverages AI to analyse large datasets and update real-time projections. Deloitte [2] notes that predictive models can generate unbiased, real-time forecasts at a lower cost while allowing human experts to adjust for context and exceptions.
Put simply:
Excel is intuitive and flexible, but manual and assumption-heavy.
AI is scalable and adaptive, but it depends on data quality and technical setup.
Table 1 compares traditional Excel forecasting with modern ML-based techniques across six key dimensions.
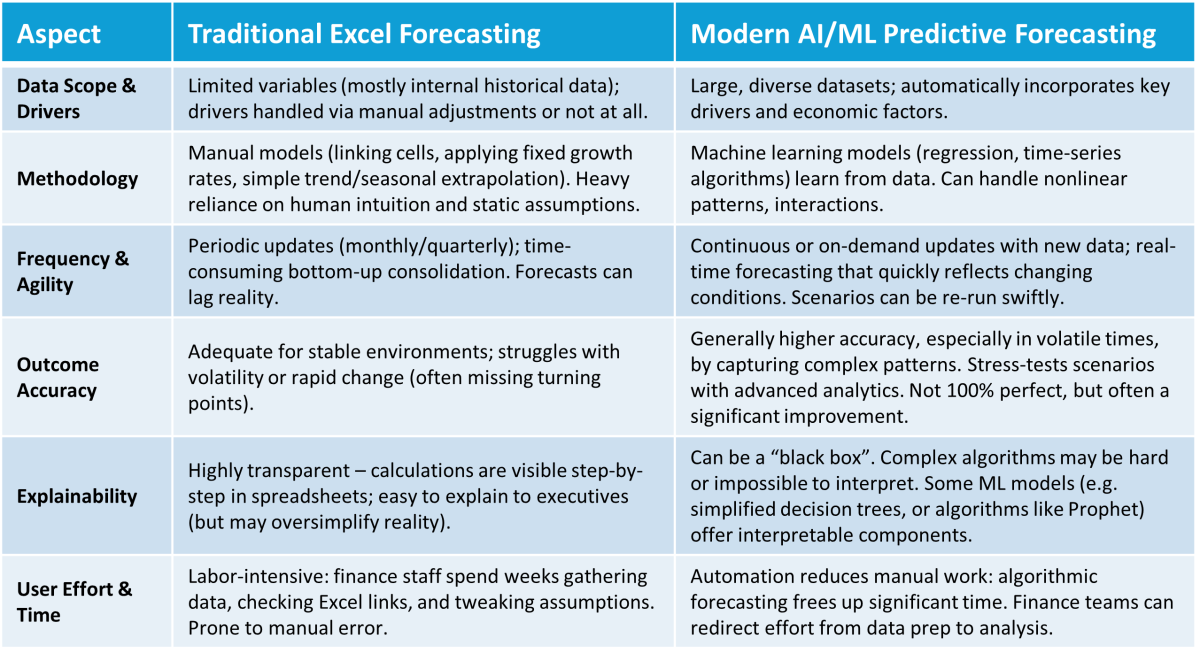
Table 1: Comparison of Traditional Excel Forecasting vs. Modern AI/ML Forecasting
Crucially, human judgment remains essential. AI provides speed and analytical depth, but human insight adds strategy, context and scepticism. The best outcomes blend the two: qualitative intuition and quantitative modelling.
This evolution turns forecasting from a spreadsheet chore into a strategic, value-driving capability.
Forecasting or Classification? Two Paths to Prediction
When finance leaders hear about “AI in forecasting,” they often think of predicting continuous metrics like next quarter’s revenue or next month’s cash flow. That’s forecasting in the traditional time-series sense. But in Machine Learning, not all predictions are numeric. Many high-value use cases in finance rely on classification, which follows a different predictive paradigm. Recognising the distinction helps CFOs select the right tool for each question.
Forecasting (Regression): In Machine Learning terms, forecasting falls under regression modelling, predicting a numeric value. Time series forecasting is a special case where the order of observations matters. Forecasting models output an estimate like “Revenue will be USD 5.2M next month” or “Operating cash flow will be USD 10.4M in Q4.” These models minimise the error between predicted and actual numeric values.
Examples: predicting sales, expenses, cash flows, or ROI on a project. Predictive forecasting models evaluate patterns in historical numeric data to extrapolate future outcomes. For instance, an insurer might forecast claim costs by analysing ages, health data and driving records. This is essentially a regression that outputs a dollar amount or risk score [3].
Classification: Classification models, in contrast, predict categories or classes. The output might be binary (yes/no, will/won’t happen) or multi-class (assigning one of several categories). In finance, classification answers questions like “Will this customer default on their payment?” or “Which regional sales team is at risk of missing its target?”
Instead of predicting how much something will be, classification predicts which category an outcome falls into (“high risk” vs “low risk”). Under the hood, these models learn patterns from labelled historical examples.
Both approaches use historical data and ML. However, each supports different decisions: forecasts for numeric planning, classifications for triage, and risk alerts.
Driver-Based Forecasting: The Power of ‘Why’
A related concept is the difference between pure time-series forecasting and driver-based predictive modelling. Time-series methods look solely at the history of the target variable, while driver-based approaches incorporate other factors (like marketing spending, economic indicators, or foot traffic) to explain why the target moves. While the two approaches often converge, CFOs should understand the trade-offs between them.
Time-series models make minimal assumptions about causality. They simply project patterns forward, which is ideal for short-term forecasts when trends are stable. Driver-based forecasting, by contrast, links outcomes to business drivers like price, volume, inflation, or headcount. This enables what-if analysis and scenario planning. The trade-off is the need for reliable, well-understood driver data and confidence in its relationship to the forecasted outcome.
In Machine learning terms, time-series forecasting often uses univariate models (a single main series), while driver-based forecasting relies on multivariate models with multiple inputs. Understanding this distinction is crucial, but it can still feel abstract.
To make this actionable, the table below maps common FP&A questions to the right techniques, outlining pros, cons and entry barriers.
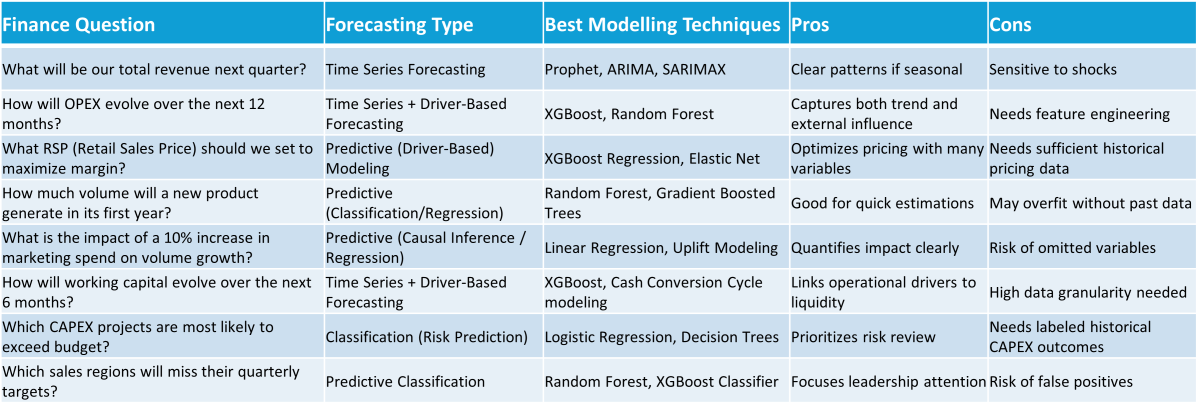
Table 2: Forecasting Techniques Mapped to Common FP&A Questions
This matrix helps FP&A leaders align each business question with the right analytical approach by balancing complexity, data availability, and time to value. For quick wins, focus on “low barrier” use cases like top-line revenue or departmental OPEX forecasts. Then scale up toward more complex, multivariate forecasting challenges.
“Prophet vs. XGBoost: Two Tools, Two Philosophies”
To illustrate these concepts, let’s dive into two popular modelling approaches that FP&A teams are experimenting with: Prophet from Meta and open-source XGBoost from the Distributed (Deep) Machine Learning Community (DMLC). Both can be used for forecasting, but they represent opposite ends of the modelling spectrum. Prophet is a univariate time-series tool with built-in handling of seasonality and trends, while XGBoost (Extreme Gradient Boosting) is a Machine Learning algorithm suited for multivariate forecasting that incorporates many features.
In practice, finance teams explore a range of forecasting tools from classical statistical models like ARIMA (Autoregressive Integrated Moving Average), ETS (Exponential Smoothing) and UCMs (Unobserved Components Models), to newer approaches like Prophet and Machine Learning algorithms such as XGBoost. Classical models are interpretable and well-suited to stable, seasonal time series. Modern tools, by contrast, offer greater flexibility and scale by incorporating multiple variables, external drivers and advanced pattern recognition. Each method comes with trade-offs in accuracy, transparency and required expertise.
Prophet: Fast Univariate Forecasting with Seasonality
Prophet is designed specifically for time series forecasting at scale. It focuses on a single target variable (such as revenue) over time. Prophet uses an additive model to decompose a time series into components: trend (overall growth or decline), seasonality (repeating patterns like yearly or weekly cycles) and holidays/events. The only required inputs are a date/time column (ds) and the target metric (y), which reflects Prophet’s univariate nature.
Prophet’s limitations stem from the fact that it expects a single time series as input. If you have multiple entities (e.g. forecasting sales for 50 stores), you generally need to run Prophet separately for each, as it doesn’t natively handle cross-sectional dimensions like store or product in a single model. Likewise, Prophet assumes a consistent structure. For example, it will detect annual seasonality and project those forward, and it can include holiday effects if you provide a list of dates. But it won’t consider drivers like price changes or competitor activity unless you explicitly add them.
For CFOs, the appeal of Prophet is speed and simplicity. You can feed in a historical series and get a forecast in seconds that “makes sense” to business users, reflecting known seasonal upticks and growth trends, all while producing results that align with known seasonal trends. The downside is that Prophet may miss nuanced relationships beyond time-based patterns. Many FP&A teams find it useful for automating routine forecasts (e.g. monthly expense projections).
XGBoost: Flexible Multivariate Modelling Across Dimensions
XGBoost is a powerful Machine Learning algorithm not built specifically for time series but often applied to forecasting problems that involve multiple variables. XGBoost allows you to incorporate a wide array of features into a forecasting model. These features can include categorical dimensions and external data. Inputs can include store ID, department, week number, promotions, holiday calendars, last year’s sales, weather, and the target variable (e.g. sales) to be forecasted.
This means a single XGBoost model can effectively forecast across many categories (stores, products) by including those identifiers as features, and it can learn the impact of various drivers (holidays, promotions, weather, economic indicators) on sales. The benefits of this approach are significant. XGBoost can capture complex, nonlinear interactions. For example, it might detect that sales increase when marketing spend is high and consumer sentiment is also strong, something a univariate model would likely miss. It can also handle multiple seasonalities or group-level patterns by using features such as store ID or region.
If Store A has a different seasonal pattern than Store B, the model can learn these store-specific behaviours by using the “Store” feature. XGBoost also tends to yield higher accuracy when there is sufficient data and relevant input variables, as it does not rely solely on past values of the target. Instead, it leverages all available predictive signals. For example, a study on electricity demand showed that XGBoost outperformed Prophet in accuracy due to its ability to learn from a wide range of inputs [7].
However, with great flexibility comes complexity. XGBoost models and similar machine learning algorithms are often called “black boxes,” referring to the hundreds of decision trees that split on various features in non-intuitive ways, making individual predictions difficult to interpret line-by-line. This can create a hurdle for adoption in finance, where trust, explainability and accountability are critical.
Finance teams are increasingly turning to Explainable AI (XAI) to address this. Techniques such as feature importance, SHAP (SHapley Additive exPlanations), and LIME (Local Interpretable Model-agnostic Explanations) provide visibility into what drives a prediction. These tools don’t eliminate complexity but offer enough transparency for FP&A teams to validate model outputs, build stakeholder trust, and retain control over the forecasting process. The goal is not to replace human intuition, but to augment it by combining AI’s pattern recognition with finance’s business judgment.
In practical terms, XGBoost is well-suited for driver-based forecasting, as it can analyse relationships between multiple inputs and outcomes across large datasets. For example, an FP&A team might run a Prophet model to capture seasonal base trends and layer on an XGBoost model to understand the impact of price, promotions, or macro indicators. Used together, they offer a more complete view by blending time-driven patterns with causal business drivers.
Conclusion: Leading the Forecasting Transformation
Predictive Forecasting is no longer a theoretical ambition. It is a practical advantage. Tools like Prophet and XGBoost allow finance teams to move beyond static spreadsheets and toward forward-looking, data-driven decision-making.
But the shift is not just technical. It is strategic. CFOs must now decide not whether to use AI, but where and how to apply it first. FP&A leaders play a key role in identifying the use cases and demonstrating early wins. The most successful teams will be those that combine business intuition with modern analytics. Start small, learn quickly and scale what works.
The future of FP&A will be shaped by those who treat forecasting not as a routine task but as a competitive capability. Begin with one question. Build from there. Take the lead.
Sources:
1. https://hbr.org/2024/11/how-ai-can-help-your-company-set-a-budget
3. https://www.fm-magazine.com/news/2023/may/4-ways-cfos-maximise-benefits-predictive-analytics
4. http://facebook.github.io/prophet/
6. https://www.ibm.com/think/topics/arima-model
8. https://www.ibm.com/think/topics/explainable-ai
The full text is available for registered users. Please register to view the rest of the article.
Related articles

In this article, the author outlines how implementing Predictive Planning and Forecasting can help FP&A professionals...

In this article, the author explores the benefits of Predictive Planning and Forecasting and outlines how...

In my day-to-day job, I interact with many Financial Planning and Analysis (FP&A) organisations implementing predictive...
+
Subscribe to
FP&A Trends Digest
We will regularly update you on the latest trends and developments in FP&A. Take the opportunity to have articles written by finance thought leaders delivered directly to your inbox; watch compelling webinars; connect with like-minded professionals; and become a part of our global community.
Anusha P.A
August 28, 2025