
This article is my sequel to my previously published “Can Accountants Grow the Beans Too?” article...

P&L Management: from Bean Counting to Creating Value
October 14, 2020
 Part 1. Environment and Market Analysis
Re-phrasing John F. Kennedy, one can say that success has many fathers because it depends on the coordinated and synchronized work of the whole company.
Often Finance struggles to deliver and present its contribution as constructive and creative because usually, it uses only the left part of the brain focusing on facts and reporting what ‘isn’t going according to plan’.
This image, sometimes labeled as ‘bean counters’, is based on the perception that Finance is about dry and cold figures that are far away from the real business, from driving growth and creating breakthroughs.
P&L Management: Create Value for your Company
This series of articles focuses on blowing up this stereotype by demonstrating how Finance in general and financial planning and analysis (FP&A) in particular can change its language, use the right part of the brain to throw light on the most important business drivers, revive figures and make them tell a story that is easy to perceive and take action on.
This type of value creation is not only limited by identification and proactive handling of the challenges related to the company’s performance, well before they become a pain, but also expands to revealing new opportunities for business growth.
The article series will pivot around profit and loss (P&L), using it as a map for this journey (see picture 1 below) by exploring its lines, going behind the figures to understand business drivers and knitting the work of multiple departments into a whole.
Most insights in this series are based on the experience from FMCG and Pharmaceutical industries but used tools are universal and can be applied in other industries. Each article can be considered as a separate narration, but a great synergy potential is also unlocked when we bind them together.
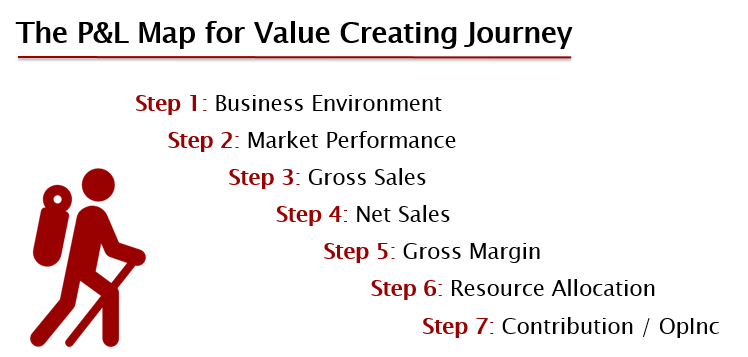
Picture 1. The P&L map for value-creating journey
Environment and Market Analysis as a Reference Point for All Future Steps
This article will focus on Steps 1 & 2 and their importance for setting the stage for the whole story. For example, a company growth of 10% looks spectacular in a stagnating market but loses all its attractiveness in a situation where a market grows 15% a year.
Before looking into a specific market, it is worth analyzing major trends from the external environment that influence not only the company but the whole market. Models like PESTEL and Porter’s 5-forces provide a framework that helps determine driving forces, make them visible and use them to our advantage.
The choice of the model or creating a hybrid from them depending on the situation and current forces driving change of the business environment at that moment. The following five-step approach can be used as guidance for the model application.
Identification and validation of relevant impact factors.
Quantification of their impact and probability.
Projection by building scenarios to model them.
Planning a response to most likely scenarios.
Implementation of actions on key threats & opportunities.
Finance is well equipped to drive such an analysis and develop future scenarios based on input from multiple departments of the company.
Identification of change drivers often leads a company to a point where it should make a decision that determines its future. When Kodak, a leader in analogue photo industry, came to such a point in the 1990s, products and services connected to analogue photo brought most of its $16B revenue delivering $2.5B profit, the company preferred to defend its terrain. This behavior finally resulted in bankruptcy in 2012.
On the other hand, Disney risked undercutting its main business and launching streamlined services in 2018-2019 even when it required to jeopardize or even cannibalize its sales. The company is building skills in new technology, increasing its chances to keep leadership position in the fast-changing entertaining industry.
After depicting major trends and driving forces, we can start analyzing market dynamics that reflects changing position of the company and its competitors. The evolution index is a convenient indicator to evaluate a company’s (its business units’ and separate products’) market performance over the years as well as benchmark it against the competition (picture 2 below).
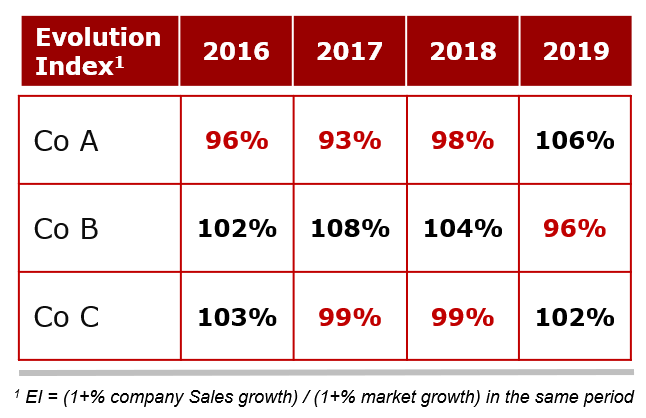
Picture 2. Competitor market performance measured via Evolution Index.
Trends tell a story; snapshots never do. We can see how Company A underperformed competition in the years 2016-18 and turned the tide in the year 2019. Zooming on Company A, we can see that this underperformance resulted in losing the market share and company ranking (picture 3 below).
The challenge is to dig behind the figures to understand what drives these changes. Examples of performance drivers can be a change of the market structure and increased demand for cheaper products or substitutes, a competitor's move like a launch of a new product or applying a new strategy for product promotion.
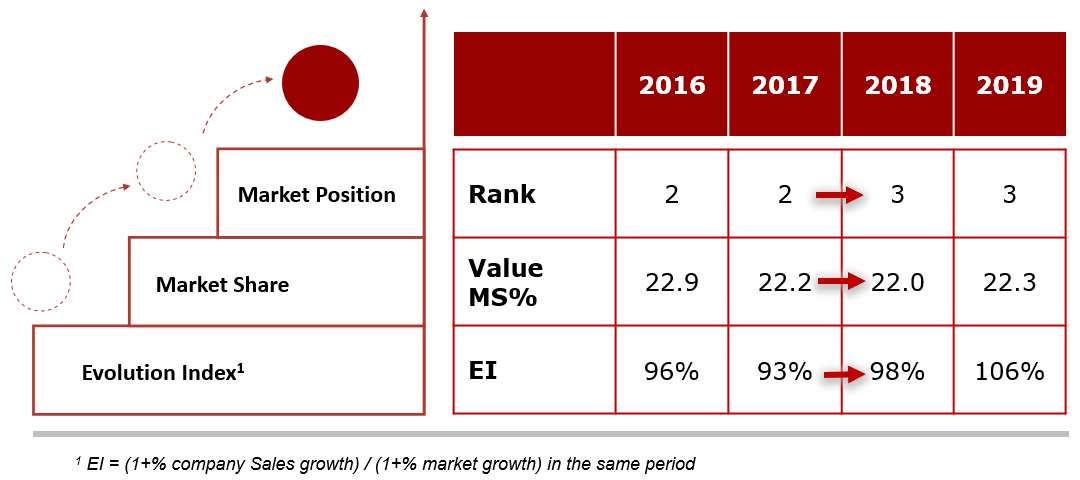
Picture 3. Company market performance measured via Evolution Index, Value market share and Market position.
Understanding the market position and dynamics create a basis for P&L analysis that can provide further answers to questions posed by the market performance and finding new ways to address current challenges and find new growth opportunities.
Conclusion
Summing up, Finance, including FP&A, often struggles to create a positive and creative image as it concentrates its attention on constraints and limitations. Instead, it can focus on storytelling, reviving figures and take P&L as a core of its narrative. It makes sense to start this story with an exploration of the business environment and then to analyze a company market performance using Evolution Index in order to create a context for the following deep-dive into P&L items.
The next article will be about Gross Sales with a focus on exploring opportunities around pricing and the peculiarity of price steering in different market environments.
Other articles in the P&L series
The full text is available for registered users. Please register to view the rest of the article.
Related articles

P&L management focuses on the items included into P&L (profit and loss) report. It has become...

In recent posts we’ve seen how tiny changes in the way we present numbers can have...

The challenges of running a modern business get tougher and tougher. Mainly externally driven challenges including...
+
Subscribe to
FP&A Trends Digest
We will regularly update you on the latest trends and developments in FP&A. Take the opportunity to have articles written by finance thought leaders delivered directly to your inbox; watch compelling webinars; connect with like-minded professionals; and become a part of our global community.