We live in a modern, technological world where data, or more accurately insights from data, can...
 "If all you have is a hammer, everything looks like a nail" - Abraham Maslow
P&L management focuses on the items included into P&L (profit and loss) report. It has become an increasingly popular technique used by the top managers around the world. P&L responsibility scope goes far beyond being simply responsible for profits or loss. Managers must not only understand what stands behind and drives each item of the report, but also need to take steps to improve P&L statements. In order for managers to be successful, they must be very confident in their ability to work with a variety of tools driving performance.
The proposed approach emerged as a synthesis of initiatives directed at P&L improvement during my work in FMCG and Pharmaceutical industries, both in country and global headquarters. Although most of the tools are already familiar to the business community, applying them in a systematic and holistic way is not a widespread practice, while that is unlocking great synergy potential. The proposed approach to P&L management allows identification and proactive handling of the challenges related to the company’s performance, well before they become a pain.

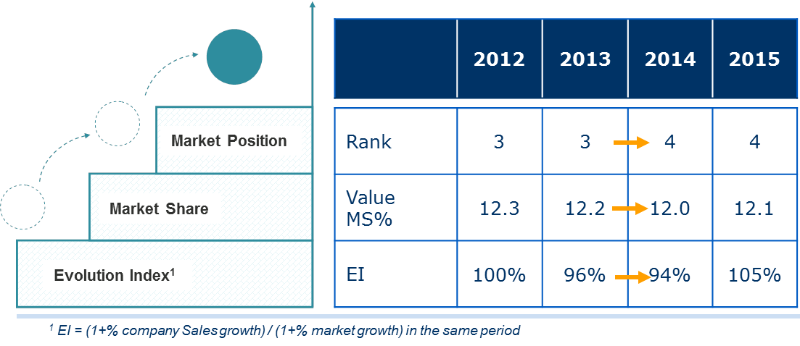
Going through P&L resembles a journey, and in the process of following the map (presented on the left side), you may gain deep insights into your business. The journey starts with studying the waters where you are going to sail. This is done with pre-P&L or market analysis, which gives you a reference point for all future steps. For example, a company growth of 10% looks spectacular in a stagnating market but loses all its attractiveness in a situation of a market boom where it grows 20% a year. Models like PESTEL and Porter’s 5-forces provide a framework which helps determine market driving forces, locate them as if they were ocean currents, make them visible and use them to your advantage.
Evolution index is a convenient indicator to evaluate company’s performance dynamics over the years, as well as benchmark against the competition. It is instrumental for explaining changes in market share and company ranking (see the picture below).
Understanding the market position creates a basis for P&L analysis, which would provide answers to questions posed by in-market performance. “Stock in Trade” is a step where we measure end-to-end supply chain inventory, it is needed for closing the gap between external data and management reporting. Its tracking is not only an important control procedure but also a tool to run the business. By saturating the distributor network with inventory before the high season, or before promotion campaigns, a company assures inventory availability for high consumer demand. Also, the company gains an advantage in the competition for limited customer shelf space. However, the ‘art’ is to keep the stock in balance and prevent the temptation to increase it even when you have an internal or ‘political’ need to drive sales.
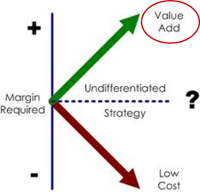
Considering the first KPI of managerial reporting, Gross Sales, it is instrumental to split it into two components: the volume of sold goods (see Resource Allocation part), and the price, which we will look into next. Taking Porter’s theory on Competitive advantage as a starting point (Porter, 1998), a company can consider price either to be defined by the market and focus on cost leadership to secure its margins or price as a variable that reflects product value. In the latter case, Porter argues that the company should choose a strategy focused on Differentiation, striving for adding value to consumers. It doesn’t mean that by choosing one strategy a company can forget about the other component, e.g. sticking to Differentiation, and neglecting the costs. It’s rather about being consistent whenever the company is making strategic choices. When pursuing Differentiation strategy, the company can’t compromise on product value, even when it is engaged in cost reduction initiatives.
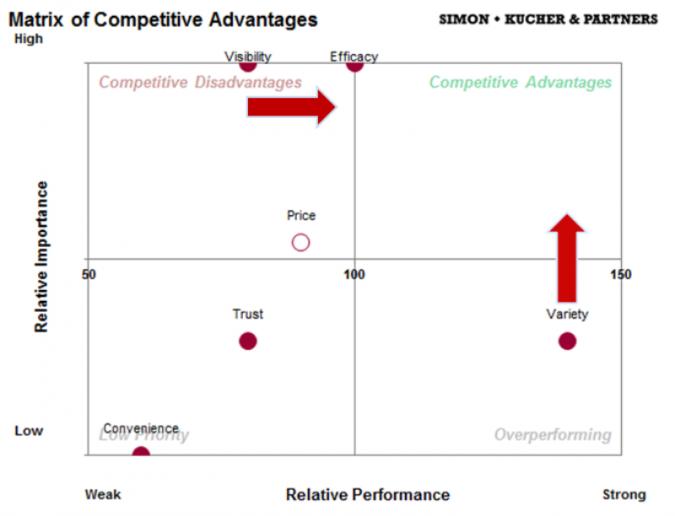
 Having committed to the strategy of Differentiation, the next challenge is to estimate product value for the customer, expressed in her willingness to pay, and measured by the price. Among widely used price-setting methods, value-based pricing is the most challenging, and potentially the most rewarding. The reward, in this case, can be manifold. It’s not only about allowing a company to set the price that most closely reflects customer’s willingness to pay, but also focusing its efforts on collecting relevant information, and understanding and increasing value of the product by promotional and product development activities. Although most of the insights on product value come from market research, it is worth to use a systematic way to structure this information in order to measure the product value. An example of such a tool is “ComStrat” from Simon-Kucher & Partners, which also helps figure out how to drive up value for each product, and set up a direction for product promotion. In the Matrix of Competitive Advantage (a view of ComStrat, see the picture below), factors affecting the product choice made by consumers are graded by their importance, and products of the company and its competitor are evaluated in terms of performance based on consumer preferences. The company can choose either to work on improving its performance on key factors (e.g., increase Visibility of its products in the picture below), or focus on communicating to consumers the importance of factors where it already has an edge (Variety in this example).

Having understood the product value, a company can further “weigh it” by comparing it with the price, which can be done in the second view of ComStrat called Value Map (see below). In the coordinate system “Relative price - Value”, a product can be located in three positions vs. competition:
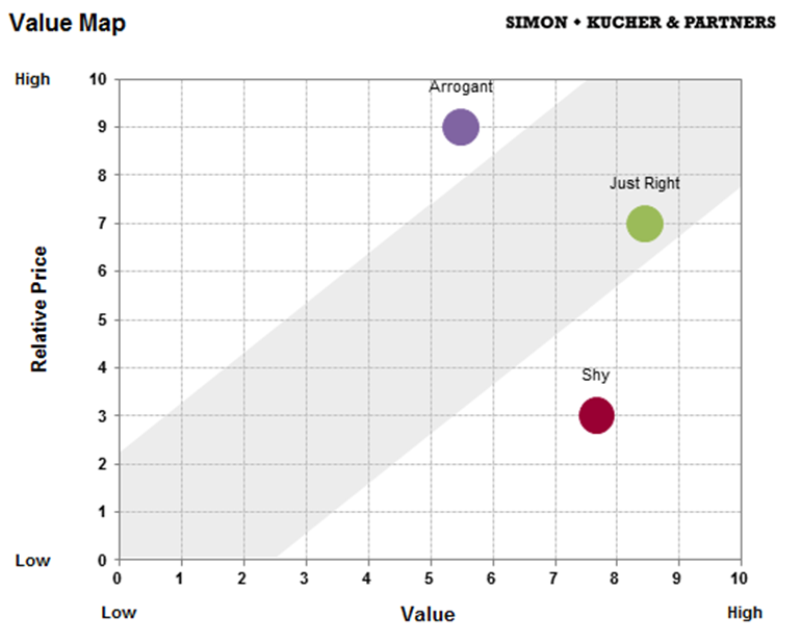

- Balance corridor: price and value are balanced, e.g. high value corresponds to high price (product “Just Right” in the picture below)
- Overpriced: price is too high for a product with relatively low value (“Arrogant”)
- Underpriced: product value is higher than its price (“Shy”).
Although position 3 looks ideal, it is not always the case, as the price is also an attribute of value. For example, Mercedes offered at the price of Lada not only would look suspicious, but also lose some of its image and perceived value. However, if carefully thought through and correctly communicated to consumers, the strategy where perceived product value is higher than the set price is a direct way to success. For example, Lee Iacocca [Iacocca Novak, 1986] gives an example of the application of this strategy, when Ford launched its Mustang brand. According to marketing research, consumers perceived the car to be 1,000 dollars more expensive than its set price. The company resisted the temptation to increase the price, and the car became a legendary success of the American car industry.
Next destination of our journey is Net Sales, and the course to it goes through waters known as Gross-to-Net (GTN). The landmark items here are discounts, bonuses and other payments, which a company offers to their direct customers, like distributors and retailers, in exchange for their services. Often, GTN system is quite complicated as it is typically built over many years in order to achieve different and sometimes even conflicting company objectives. This makes it not very transparent and difficult to comprehend for both customers and even people within the company. Therefore, setting a system for regular revision and control of GTN gives the company a lever to increase both Sales (via focusing discounts to enhance Sales drivers) and Profit (by eliminating low-value elements of GTN). The approach can be framed into the following 3 steps:
- Understand a value of each discount, and only pay the minimum required
- Focus on value-creating discounts and bonuses
- Embed GTN control into company’s procedures
Having applied this system in its Ukrainian subsidiary, a large international pharmaceutics company managed to cut total GTN from 13% to 6%. This was mainly achieved by substituting 9% unconditional Sell-in discount by conditional performance-driven bonuses. Moreover, such a project changed the mindset within the company, moving GTN from an "unconditional" and "determined by the market" to a "choice" and "resource" area, which should be managed like all other resources.
Presentation of the three components of Sales increment (vs. previous period or budget) – price, volume and GTN – gives insights into what drives Net Sales in the period of analysis, while its dynamics versus competition allows to evaluate whether the selected strategy is right.
Marginality or Gross profit (our next shortstop in the journey) is driven not only by Price and COGS, which are specific for each business but also by forecasting accuracy. Forecasting is a tool of management control, which pushes business to learn about environmental changes before they become a pain. Increasing forecast accuracy not only provides tangible benefits like reduction in inventory levels and write-offs but also intangible ones like improvement of relationships with production units and suppliers.
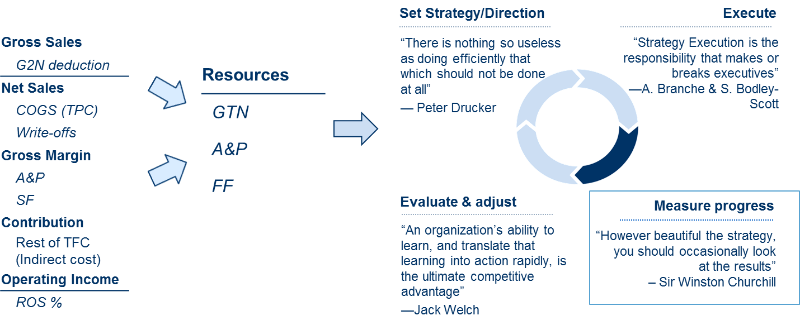
Considering the Functional costs, a company should focus on getting maximum results from effective allocation of its limited resources. This task is also known as productivity improvement. Typically the resources of an FMCG company consist of GTN, spend on advertisement and promotion (A&P), and Field Force (FF). An objective of the whole process is to distribute these resources in a meaningful way to achieve company’s goals. Usually, the process of resource allocation is done in four stages, starting with setting of Strategy, then proceeding to Execution and Measuring the progress, and closing the loop with evaluating results, learning and making necessary adjustments (see the picture below). Although each stage is important, and a mistake at any point can lead to calamitous results, here we will focus on progress measurement as a part of P&L management.

Due to the complexity of this task, business usually sets up KPIs for measuring each resource separately. Improving outcome for utilization of each resource leads to the improvement in overall business efficiency. For Field Force, KPIs can be Weighted Distribution and Off-take (an average number of products sold by an outlet in a certain period).
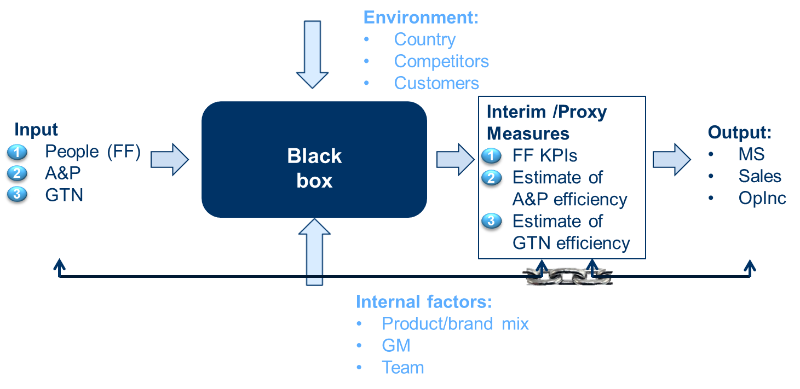

The key to successful application here is to divide KPIs by territory and channel, and link them to incentive systems of the responsible managers. One of the most impressive business turn-arounds in my practice, when Evolution Index jumped from 94% to 111% in half a year, was done in Russian subsidiary of an international pharmaceutical company. A small number of very clear KPIs were set for the whole Sales organization, and management pursued their improvement by implementing a rigorous control procedure. As a result, a substantial positive change was achieved by performing simple small steps, made consistently and in the same direction.
To estimate required A&P investments, a company can consider changes in volume between historic trend (projection of market and company data from the past), and actual performance versus market, in order to estimate incremental Sales and Profit as a result of marketing activities or price changes. In this case volume data should be taken from an external source (e.g., Nielsen or IMS), while internal data can be used for a net price (incl. GTN) and A&P investments.
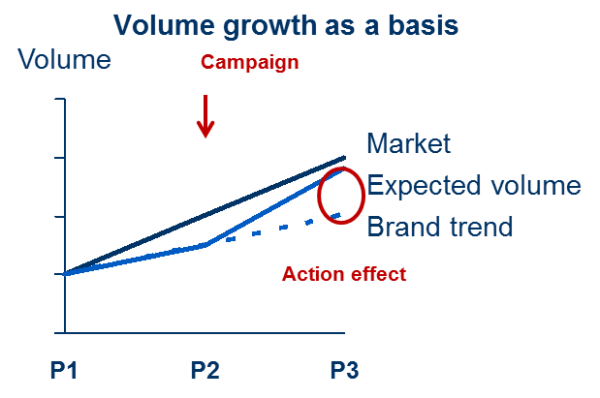

Although profit is a bottom line of P&L, and an ultimate goal of most businesses, a company often seeks a balance between profit maximization, Sales (and/or Market Share) growth, and liquidity (including Net Working Capital optimization). For example, for Differentiation strategy and value-based pricing, it is recommended not to capture the whole value surplus against competition in the price, but rather share it with consumers (Simon, 2015). In this case, the higher price captured by the company contributes to its profit, while residual value surplus helps the customer choose in favor of company products (hence driving Sales). In the example about Ford Mustang, described above, it would mean that the company had a chance to raise the price by $500, having estimated $1 000 price delta with consumer perceived value.
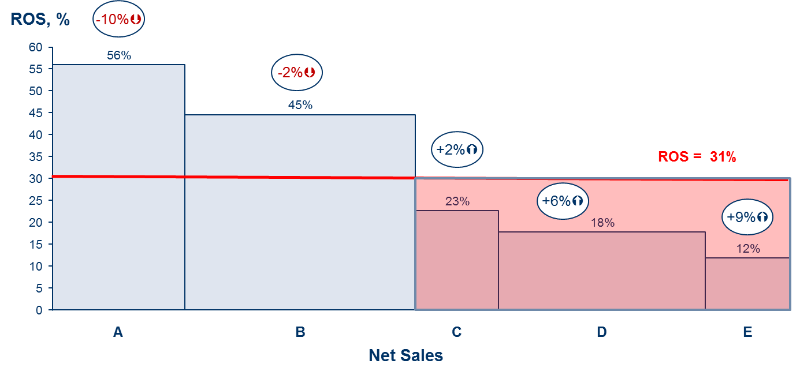
Profit, and especially Return on Sales (ROS) component, allows looking at the company performance from a somewhat unfamiliar side (as presented below), which helps make better strategic choices. This view presents Sales by product group on axis X, while ROS is shown on axis Y, which reveals contribution of each group of products to overall company profitability. Sales growth marker at the top of each bar adds insight into dynamics to the chart, and shows in what direction company profitability would move in the near future.

A regular journey along P&L, done in a systematic way like the one described above, offers managers new insights into the business. It also expands their arsenal with the new tools, and helps learn when and in what situation to use each tool. This ultimately allows the company to avoid icebergs, identify growth opportunities along the way and increases chances of success.
Bibliography:
Iacocca, L., & Novak, W. J. (1986). Iacocca: An Autobiography. Bantam.
Porter, M. E. (1998). Competitive Advantage: Creating and Sustaining Superior Performance. Free Press.
Simon, H. (2015). Confessions of the Pricing Man. Springer.
Subscribe to
FP&A Trends Digest

We will regularly update you on the latest trends and developments in FP&A. Take the opportunity to have articles written by finance thought leaders delivered directly to your inbox; watch compelling webinars; connect with like-minded professionals; and become a part of our global community.


