
P&L management focuses on the items included into P&L (profit and loss) report. It has become...

P&L Management: Driving Net Sales and Improving Marginality
February 25, 2021
 This article is part of the series “P&L Management: from Bean Counting to Creating Value” that focuses on demonstrating how finance can shed light on important business drivers, revitalize figures and make them tell a story, creating value for the company. Using P&L as a map for the journey (see image 1 below), the first three articles explored three initial steps focusing on the pre-P&L analysis and price management.
In this article, we will move via net sales to marginality and look at how finance can take initiative and lead the effort to increase both sales and business profitability.
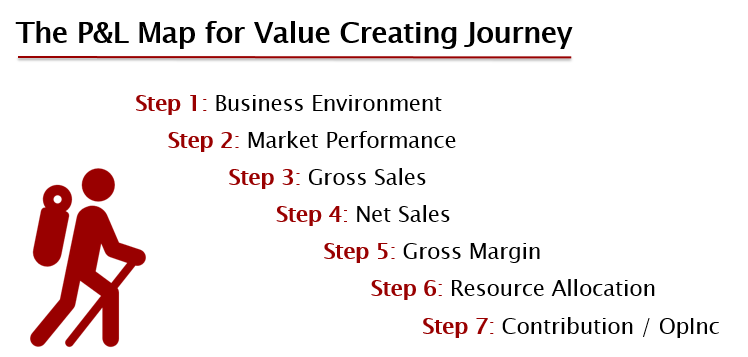
Image 1. The P&L Map for a value-creating journey
Use discounts to achieve your goals
A transition from Gross to Net Sales goes through the Gross-to-Net (GTN) adjustment. GTN is a common definition for allowances, discounts and bonuses, which a company offers to its customers like distributors and retailers, as well as refund them for the goods return. Often, companies pay much less attention to GTN than to the functional costs as they consider it unavoidable, i.e. some kind of market ‘tribute,’ that should be paid to be in the business. In addition, a GTN set-up of a big and mature company is quite complicated as it is typically built over years in order to achieve different and sometimes even conflicting objectives. This makes it not very transparent and, in some cases, difficult to comprehend for both customers and even people within the company.
Therefore, setting up a system for GTN control and its regular revision gives a company a lever to increase both Gross Sales (by providing discounts driving Sales) and Net Sales / Margin (by reducing GTN). The approach can be framed into the following three steps:
Understand the value of each discount for the customer, and pay the minimum required. For instance, it might be worth exploring whether and how a reduction of volume discount from, for example, the current 5% to 2% would change an incentive of a distributor to buy more from the company.
Focus on value-creating discounts and bonuses. It is not only important to give an incentive for certain services from the customer, but to set and keep running a system of control how these services are delivered and whether they produce an intended effect.
Embed GTN control and revision into the company’s procedures. Often, even the best working programs for distributors and retailers are losing their effect over time as the customers consider them as part of general conditions and gradually slip out of fulfilling their obligations. Therefore, it is not only control but also a regular revision, upgrade and update of the GTN system that produce a positive effect on a company’s financial results. For example, one FMCG company has established a monthly procedure of estimating benefits received from discounts comparing with the incurred cost. This triggered regular discussions in the leadership team and periodic revision and update of those GTN elements, benefits from which were systematically lower than costs or didn’t deliver intended results.
For reporting and analysis, the first step usually boils down to an understanding of the company results versus competition (see the first article of this series), which allows management to evaluate whether the business strategy delivers the intended outcome. The second step, analyzing three components of Net Sales deviations vs budget (and vs the previous year) – price, volume and GTN – provides insights into details and helps understand better what stands behind the top line result and its discrepancy with the plan.
We will come back to GTN while talking about resource allocation.
Focus on marginality
Marginality, the next step of the P&L journey, is driven not only by Price and GTN, discussed earlier, but also by Cost of Goods Sold (COGS), which are specific for each business and depend on multiple factors, e.g., the business model (especially the value creation component), strategy, technology, etc. In this article, we will look at just one variable component of COGS, the write-offs.
In most cases, the reasons for write-offs are directly or indirectly linked to forecasting accuracy. For example, one big pharmaceutical company investigated the root causes of write-off growth and found out that forecast inaccuracy stands behind ¾ of all losses driven by write-offs. In order to address this issue, the management decided to set up a cross-functional team and initiated a project with the objective to build a sustainable system that should allow…
…the Head Quarters to get transparency for the write-offs and measure the progress in their reduction
…countries to receive a tool to dig into the root causes of write-offs and to search for solutions to the problem.
Example of fighting write-offs
The following functionality was realized to improve forecast accuracy and reduce write-offs:
1. Head Quarters Dashboard was created to show monthly dynamics of the write-off provision on global and regional levels with a possibility to drill down to the specific result in each market and for each product in order to identify main offenders and to see where provision reductions were achieved.
2. Countries received a tool to investigate root causes of provision for each stock keeping unit (SKU) by comparing several versions of SKU’s forecast from the past with its actual sales. Such an analysis allows a country team to understand the real drivers for each increase in the write-off provision, which could be, e.g.:
Wrong underlying assumptions for sales expectation
Not recognized trend in actual sales
Competitor actions (a launch of a new product or an aggressive promotion campaign).
A root-cause analysis forces the team to reveal factors, which are not lying on the surface. The established procedure requires documenting lessons learned in order to take them into account in further forecasting.
3. The same tool allows countries to get information on the remaining shelf life of existing inventory. Such information is helpful in order to find a solution to the excess inventory and avoid transition of the provision to the actual write-offs because a company can undertake preventive actions like the following:
Organize a promo-action to accelerate sales combined with providing a discount on the product under the provision.
Move the product to other geographies, which often requires additional cost not only for transportation but also for re-packaging.
The system contributed to turning forecasting into a tool for business control: each time identifying a factor, which resulted in a significant deviation between forecast and actual sales, a team should find out its reasons, drivers and then a way of either influencing this factor or getting information on its changes as soon as possible. As a result, a commercial unit receives not only tangible benefits like reduction of write-offs but also intangible ones like improvement of relationships with production units and suppliers. In such a way, the implemented system influences multiple cost components in the supply chain and leads to the reduction of COGS and improved marginality. The system also allowed finance to provide transparency via the use of dashboards and facilitated internal discussions and learning from mistakes.
In addition, such a system is an important preparation step for further automation, where human learning can be substituted by machine learning. Artificial intelligence technology can be applied not only for identifying trends that humans have difficulty recognizing but also for ‘remembering’ lessons learned from the past.
Conclusion
All in all, the three-step approach can be recommended to set up a system for regular revision and control of GTN, which gives a company a lever to increase both Gross Sales and Net Sales / Margin. Another way for increasing marginality is an improvement in forecasting accuracy. Having created transparency of the write-off provision and a tool to investigate its root causes, a big pharmaceutical company not only reduced write-offs but also received intangible benefits in improved relations with stakeholders and prepared better for further automation.
In the next article, we will move from marginality to resource allocation and measuring the efficiency of resource usage.
The full text is available for registered users. Please register to view the rest of the article.
Related articles

This series of articles focuses on blowing up this stereotype by demonstrating how Finance in general...

Price is a strong lever of the company performance, which is often underestimated. Having mastered price...

In this article, we will stay with the price and look at another example how it...
+
Subscribe to
FP&A Trends Digest
We will regularly update you on the latest trends and developments in FP&A. Take the opportunity to have articles written by finance thought leaders delivered directly to your inbox; watch compelling webinars; connect with like-minded professionals; and become a part of our global community.