FP&A teams all over the world are undergoing a major transformation via the Integrated FP&A model...

Introduction
Asfordby Mine was the last major capital project undertaken by British Coal. While it was completed in the 1990s, its outturn cost would be over a billion pounds at today's prices.
I was involved in this project as an Operational Research Scientist and accountant appointed as an Information Systems Manager. I worked with management consultants on installing the project information system and was responsible for its maintenance and development.
Although the project was completed years ago, the techniques and technology used for planning and analysis were leading-edge and may still interest FP&A professionals. It was one of the most interesting and challenging roles in my career, and I hope my experience will be helpful to other FP&A professionals.
I believe there is a lot to learn from the open-minded and flexible approach we took then to help us now with novel and disruptive technologies such as Generative AI. In this case study, I am going to cover the following aspects of this large project:
- organisation,
- the plan structure and cost model,
- putting the model to work,
- dealing with unexpected factors,
- what did help us bring added value,
- finally, how would Machine Learning help (if it were available then)?
Organisation
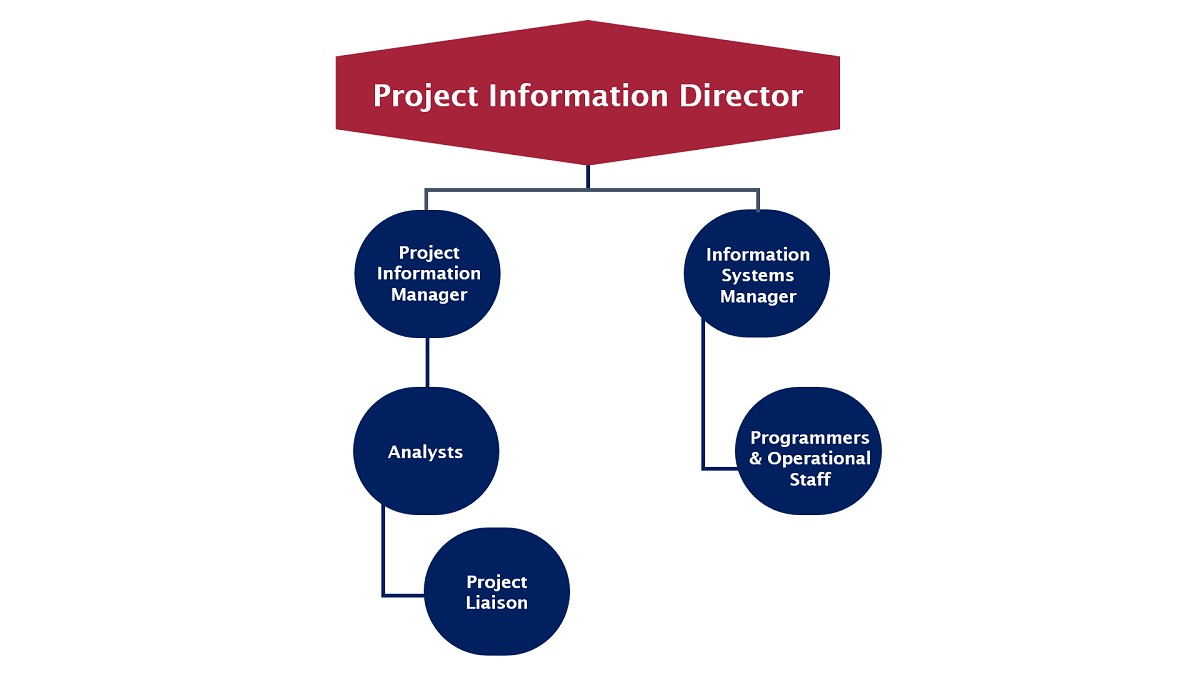
Let us begin with the team structure of which I was a part. At the time of undertaking this project, our team was organised as follows:

Figure 1: The Project Information Team Organisation
As you can see from the figure above, our team had a hierarchy, and each was responsible for performing specific functions. Below, I will explain the team's core responsibilities. The Project Information Director (the Deputy Project Director) was the sponsor of the project information system while being a senior mining engineer. The Project Information Manager was a mining engineer responsible for data collection, analyses and forecasts. The analysts, engineers and finance specialists were responsible for producing forecasts, investigating variances and highlighting issues. Project Liaison Officers were engineers who managed data collection from contractors. As Information Systems Manager, I was responsible for systems development and reporting. Programmers and operational staff were responsible for maintaining and operating the system. This team worked with the cost model and plan structure, which I will outline below.
The Plan Structure and Cost Model

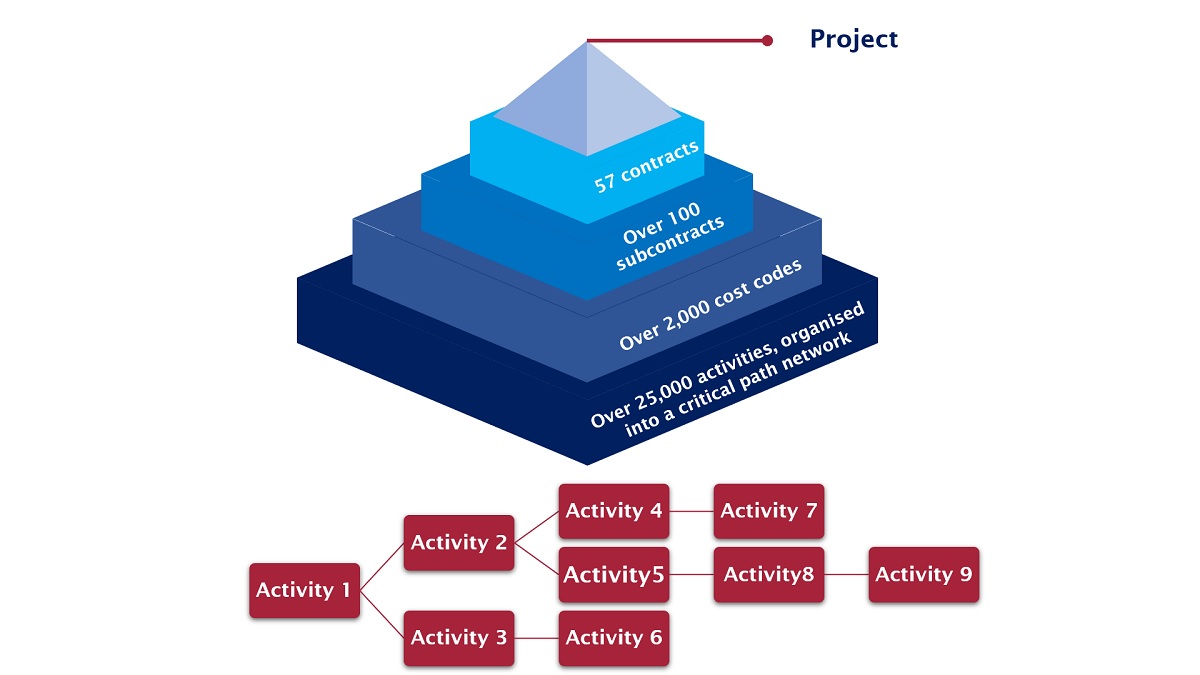
Figure 2: The Plan Structure and Cost Model, Showing the Critical Path Analysis Model
The cost model was a multi-layered structure. Physical progress against the plan was recorded in around 25,000 activities, and the outcome of weekly progress was determined using critical path analysis. This critical path analysis calculated the completion of every activity through to the project's end, together with plan variations. In addition, the critical path allowed the team to highlight those activities each week which might affect the progress of the whole project.
At the time, the model aggregated and reported financial progress and variance analysis each month through cost codes, sub-contracts, contracts and the project itself, which was then a state-of-the-art process. The next aspect to consider was how to put this model to work.
Putting the Model to Work
The integrated model provided one version of the financial and physical truth across the whole project at the appropriate level of detail – project, contract, sub-contract and activity.
This project was quite complex, consisting of 57 major contracts, some of which were subcontracted. As you remember, the Project Liaison Officers would collect progress information from the contractors and enter this data into the system.
Upon consolidation of all information, the analysts would identify progress and cost variances. As the Information Systems Manager, I was responsible for a Highlight Report for the project directors, which identified overall physical and financial progress, variances and risks.
The financial measurement was done by outturn cost, i.e., the actual construction cost, adjusted for inflation rates.
Finally, we tailored a solution that allowed the system to report the following variances:
Variances in the Plan
- Technical changes – we knew that any physical change to the project necessitated extra cost. For example, the ground proved to be more waterlogged than expected, necessitating an operation to freeze the surrounding area before the shaft sinking.
- Progress – we also knew that delays would increase outturn costs owing to inflation, which at the time was quite high. Similarly, reorganising activities might reduce costs by bringing expensive items forward.
- Inflation – this variance recorded the changes in the economic environment.
- Over/Underestimates - this variance became helpful when the above had already been considered by identifying inaccuracy in determining the original cost of a set of activities.
It all resulted in actual and forecast statements.
The Project Liaison Officers followed up with the activity variances, while the analysts were responsible for following up with the cost variances for their allocated contracts. Simultaneously, Project Information Manager was responsible for reporting on the project at executive meetings. However, some unexpected things came up, and we had to deal with them as a team.
Dealing with the Unexpected

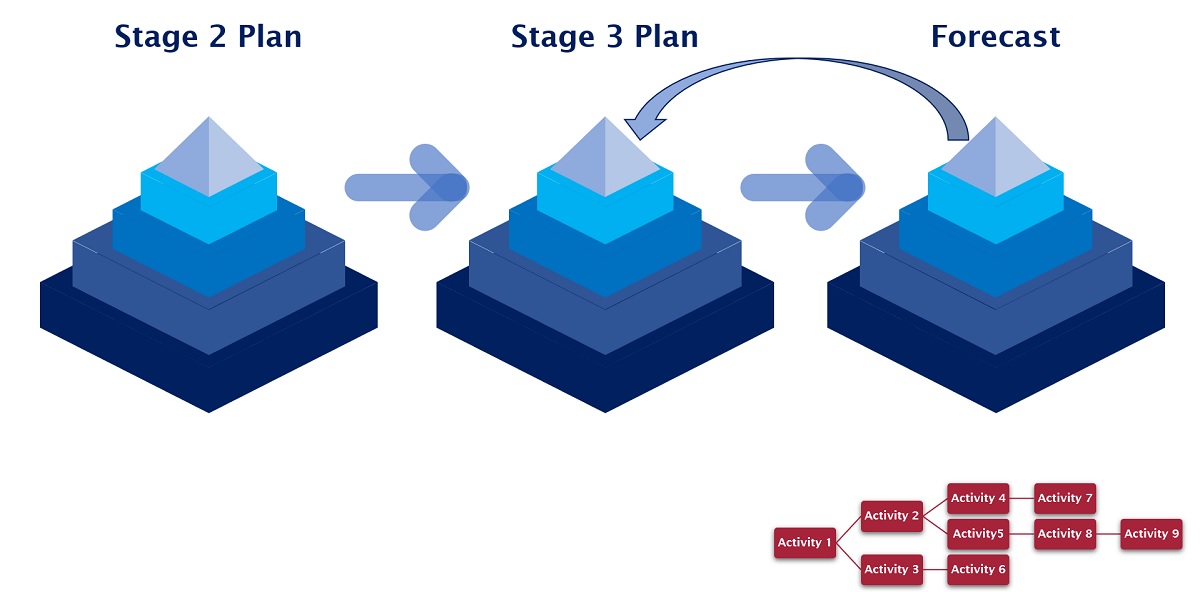
Figure 3: Controlling the Project Against the Plan
In the figure above, I am deep-diving into the details of controlling this project. I use "Stage 2" to refer to the original detailed plan followed at the start of the project, while "Stage 1" was a high-level plan at the approval stage.
At the beginning of the project, "Stage 2" was copied to "Stage 3", which was the operational plan and, again, to the forecast. As progress was reported and the forecast was updated, variances from "Stage 3" were examined by management. If the variances were permanent, for example, a technical change such as the necessity to freeze the ground before starting on the shaft, then the "Stage 3" plan was updated following approval by the Project Director.
The forecast was monitored against the "Stage 3" plan. Simultaneously, the "Stage 3" plan was monitored against the "Stage 2" plan to report all the approved and current variances from the original.
What Did Help Us Bring Added Value?
Collecting all the progress and cost data into a central location permitted important value-added activities in addition to project reporting; for example, what-if analyses and minimisation of risks.
- What-if analyses
The effects of technical changes on the whole project could be tested, and then the cost could be calculated. It would include introducing extra activities such as ground preparation, not anticipated in the original plan, or the effects of rescheduling contractors. The latest data would always be readily available for prompt and accurate turnaround.
- Minimisation of risk
The involvement of 57 major contractors and many subcontractors presented a considerable financial risk. If a contractor could not start on time because another were late, the project could have been liable for sizable penalty costs. The model identified these risks and acted as an arena for solutions to be tested.
How Would Machine Learning Help If It Were Available Then?
We drew on operational research techniques using highly trained practitioners in those days. These days such techniques are much more widely available under the umbrella of Machine Learning.
Today's computing power and data management techniques greatly enhance the power of these tools:
- Regression – FP&A professionals can use it to identify cost trends and forecast inflation.
- Monte Carlo Analysis – such a tool can help simulate stochastic variables in what-if analyses to determine the probability of an event and its impact on the project.
- Classification may greatly help identify the project's issues – for example, is it the case that contractors have bid too low and hope to recoup this through penalties?
- Clustering can help us understand which areas of the project are generating the most risk.
Summary and Conclusion
At the time, this project was a novel technology and required a lot of staff, which was justified by the size of the project. The cost of the project information team was 1% of the total project cost. The project was completed on time and within cost, and the processes I have described above substantially contributed to this.
This project involved close integration with management consultants, an openness to new technologies, flexible working practices and staff with curiosity and a propensity to learn new techniques. It represented a cultural change for the organisation, which, from the point of view of project information, proved to be very successful.
In these current times of rapid change, for example, with the introduction of generative AI, this project culture, even after several years, strikes me as a handy template. When I took over as Information Systems Manager, it was made clear to me that this extraordinary project would require extraordinary commitment. It did, but I profited greatly from it in my later career in Enterprise Performance Management.
Subscribe to
FP&A Trends Digest

We will regularly update you on the latest trends and developments in FP&A. Take the opportunity to have articles written by finance thought leaders delivered directly to your inbox; watch compelling webinars; connect with like-minded professionals; and become a part of our global community.


