
In this article, you’ll discover how FP&A leaders can drive sustainable margin expansion by turning forecasting...

The Growth–Profitability Trade-Off: How FP&A Guides Smarter Choices with Frameworks
November 18, 2025

Most companies want to use FP&A to help them outperform their peers, which can be done by growing faster and more profitably. Achieving both high growth and strong profitability is a deceptively difficult task. A simple benchmark, doubling revenue every five years, sounds attainable; however, few companies sustain it. Why?
Four common constraints often stand in the way:
Lack of product differentiation (customer)
Inefficient infrastructure (systems)
Limited leadership development and weak teamwork (collaboration)
Insufficient capital (funding)
FP&A can play a pivotal role in overcoming these challenges by deeply understanding the business model and measuring performance against simple frameworks. While most FP&A teams conduct monthly financial reviews, these can either become routine box-checking exercises or evolve into strategic conversations that align leadership and drive results. The goal is to transform numbers into context, using each review as a chapter in a strategic narrative that helps the business outperform. This is no easy task.
Even success can breed complacency, and scale can introduce bureaucracy. Staying focused on high growth and high profitability requires discipline, insight, and adaptability.
Knowing the Business Model and How the Income Statement Helps Measure Performance
The income statement is the most commonly used report in monthly reviews, reflecting how well the business executes its plan. Though this may seem straightforward, many analysts aren’t deeply familiar with using the income statement to assess performance against the company’s business model.
I recently spoke with a friend working with investors to define performance metrics. He felt the bankers didn’t really understand the business, focusing solely on a static EBITDA valuation instead of the dynamics that influence how EBITDA grows or declines over time, which drives the valuation multiple.
For FP&A professionals, this highlights a key responsibility: collaborating with the business to ensure that metrics are aligned with strategy and that strategy is aligned with the four common growth constraints identified above. Let’s explore how FP&A can partner with the business to help influence decisions that keep the organisation nimble, focused, and adaptable.
Focusing on Marginal Impact and the Growth and Profitability Matrix
While revenue and expenses are headline metrics in the income statement, the real story lies in their relationship. This is where basic cost accounting becomes essential.
By breaking down revenue into volume and rate variances, and doing the same for compensation, we can isolate the change drivers in the P&L. If we are a restaurant and want to increase revenues, we can either sell more meals or raise prices. If we want to adjust costs, we can increase or decrease the number of workers or change their hourly rate. However, to go further, we need to apply basic economics, specifically, the relationship between marginal revenue and marginal cost. Simple economics would say that when marginal costs exceed marginal revenues, we should forgo extra expenditures.
However, that’s not that easy. Consider the restaurant example again. While the food cost can be variable by unit, the labour cost can indirectly relate to sales, so we have to calculate an average compensation cost per unit. This is easier to see when we examine how the typical customer perceives an electric bill. While you may not be aware of it, when we consume electricity, we are charged a tiered price that increases with the amount of electricity used.
We might pay $0.10 for the first 100 kilowatt-hours and $0.20 for the second 200 kilowatt-hours. Researchers have examined how consumers respond to these cost changes, and they have almost entirely focused on average price changes instead of marginal ones. It’s these average costs that appear in the P&L that FP&A can help further examine.
To address these complex nuances, we break down the income statement into a simple yet powerful framework — the Growth & Profitability Matrix (Figure 1). This tool helps us evaluate not just whether the business is growing or profitable, but how it is growing, and whether that growth is sustainable.
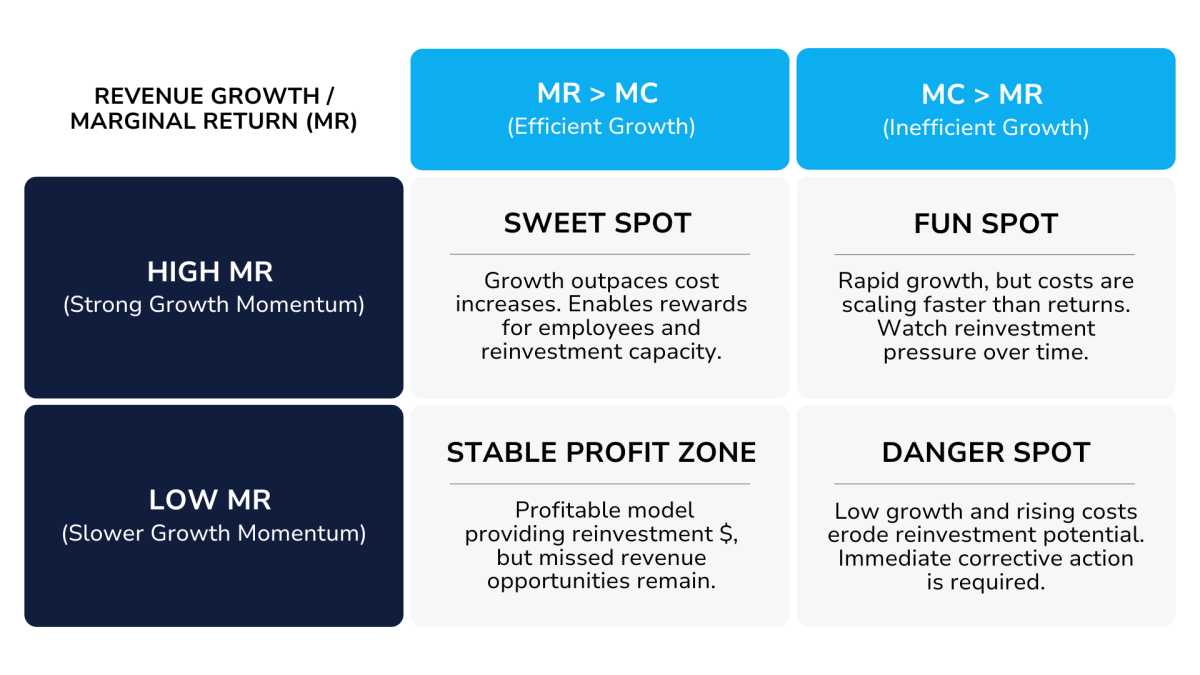
Figure 1. The Growth & Profitability Matrix
Scenario 1: High Revenue Growth, Marginal Revenue > Marginal Cost
Sweet Spot — 10% revenue growth, 8% compensation growth → 16.3% EBITDA growth and 1.7% margin expansion. This is the ideal scenario: revenue is scaling faster than costs, enabling reinvestment in talent and infrastructure. Compensation grows, but at a sustainable rate, supporting both employee rewards and firm reinvestment.
Scenario 2: High Revenue Growth, Marginal Cost > Marginal Revenue
Margin Squeeze — 10% revenue growth, 12% compensation growth → 8.3% EBITDA growth and 0.5% margin dilution. While returns are solid, the model is unsustainable. Compensation is growing faster than revenue, which limits reinvestment capacity and may signal operational inefficiencies or overextension.
Scenario 3: Low Revenue Growth, Marginal Revenue > Marginal Cost
Stable Model — 5% revenue growth, 4% compensation growth → 7.7% EBITDA growth and 0.8% margin expansion. This scenario shows strong revenue and cost growth alignment, creating reinvestment dollars. However, despite better margin performance, the lower revenue base limits EBITDA growth compared to Scenario 2.
Scenario 4: Low Revenue Growth, Marginal Cost > Marginal Revenue
Unsustainable Model — 5% revenue growth, 6% compensation growth → 3.7% EBITDA growth and 0.4% margin dilution. Although still profitable, this model is fragile. Cost growth outpaces revenue, eroding margins and limiting reinvestment potential. Without intervention, this trajectory may lead to stagnation or decline.
These scenarios are further illustrated in the financial outcomes shown in Figure 2, which detail how revenue growth, compensation growth, and operating expenses flow through to EBITDA and margins.
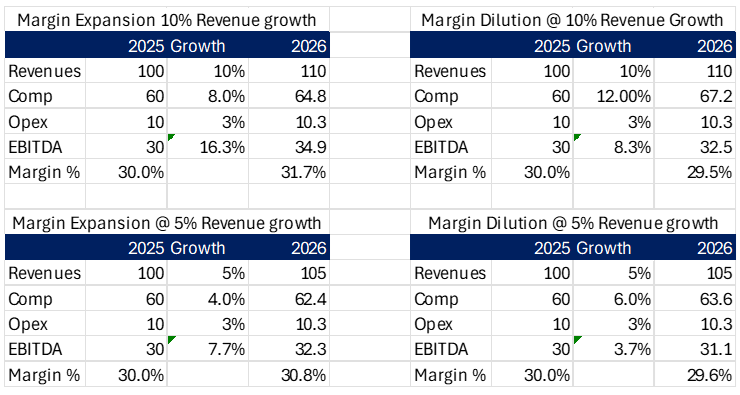
Figure 2. Scenario Financial Outcomes Table
Using Inquiring to Understand Strategy
While the four scenarios are a good guide, the good business partner asks a lot of questions to understand why we are in the quadrant we are — and how it relates back to the 4 obstacles — lack of product differentiation, Inefficient infrastructure (systems).
Limited leadership development, weak teamwork (collaboration), and insufficient capital (funding). We should examine this framework over multiple periods — specifically, the current period, the current year, the three years preceding it, and the projected three years ahead to see how timing evolves and which quadrant we are in and want to be in.
The ability to present different interpretations of the same information, while posing tough questions to achieve alignment on strategy, is key. Consider the electricity bill example above; the average biases also apply to businesses.
Bills tend to increase over time, so using the last month as a forecast, rather than the average, may provide a more accurate prediction.
Certain costs are investments that can take 2-3 years to provide a return on investment. Understanding why we classify costs differently in the income statement versus the balance sheet is critical. Don’t treat the Growth and Profitability Matrix framework as an answer key — it is a tool to help us ask better questions!
Key Takeaways for FP&A Leaders
Don’t let EBITDA be the only measure. Start with understanding strategies and the business model, then link metrics back to both.
Switch the conversation from average margin to incremental changes in revenues and expenses. Examine marginal revenue versus marginal cost to determine whether growth is creating real value or eroding margins. Show different time periods and different assumptions to get alignment with the leadership team.
Use this framework to ask how we can partner with the business to develop levers that can help increase marginal performance on revenues and expenses.
In Part II of this article, we will examine how to take a deeper look at both revenues and expenses to help differentiate between average costs and marginal costs.
The full text is available for registered users. Please register to view the rest of the article.
Related articles

In this article, Campari Argentina’s FP&A team shares how they built FP&A revenue growth capabilities through...

This series of articles explores dynamic pricing's effectiveness and the challenges caused by fluctuating market conditions.

FP&A people should develop a good understanding of competitiveness. It is not just about the general...

In this series of articles, we delve deeper into the importance of finding the right balance...

A company must maintain short-term and long-term profitability, especially in uncertain times. This can only be...
+
Subscribe to
FP&A Trends Digest
We will regularly update you on the latest trends and developments in FP&A. Take the opportunity to have articles written by finance thought leaders delivered directly to your inbox; watch compelling webinars; connect with like-minded professionals; and become a part of our global community.