Nowadays, everyone is talking about being ‘data-driven’. What lies beneath this idea, is the wish to...

1. Data-Driven Planning Architecture
1.1 The Spreadsheet Dilemma
For the models described in this set of blogs to work effectively, some form of planning technology will be required. For most organisations, that technology today is the spreadsheet. Spreadsheets have been the dominant tool within organisations for planning, forecasting and management reporting for the past 20 years. And despite the availability of systems aimed at finance, Gartner estimates that around 50% of large and 75% of mid-size organisations still use spreadsheets for enterprise planning and reporting.
This is due to a number of reasons, including their relatively low cost of deployment - everyone has access to a spreadsheet; simplicity in setup and use - most accountants know how to use a spreadsheet without the need for specialist training; and because of their extensive reporting and analysis capabilities. But as an organisation grows in both users and information requirements, those same spreadsheet systems quickly turn into a liability and a major source of concern. The limitations of a spreadsheet are well known and are due to their fundamental design.
Enterprise Systems: The Alternative to Spreadsheets
Specialist enterprise planning and reporting systems have been available for many years. They were developed specifically to overcome the limitations of spreadsheets and possess several common capabilities, such as being multidimensional, multi-user, and having name-based rules, workflow and integrated reporting. But despite the advantages over spreadsheets, there are still some fundamental issues that stop them from supporting the data-driven planning framework outlined in these blogs.
To begin with, planning systems are often sold as discreet products aimed at particular processes or applications. For example, many software vendors offer budgeting systems but require further systems to enable results to be analysed or reported as a scorecard. Although some vendors offer ‘suites’ that contain the promise of an integrated solution, that integration is often limited to moving data between applications, which increases the overall solution's complexity and cost).
Similarly, throughout the description of the seven planning models, it is evident that the underlying data structures of each are quite different. Some are multidimensional in nature, while others are relational, and all are associated with text/dates and other data types. Most mainstream planning systems only support one kind of database, and if multiple sets of data are supported, then it’s up to the user to decide when data ‘moves’ between models. This can lead to integrity issues and greatly increases the complexity of the final solution.
As a consequence, organisations find themselves implementing multiple products with different architectures and setup procedures. But things are changing, and new systems are appearing that are more able to support planning as a single enterprise solution. In the same way that ERP transformed the ‘back office’ requirements of general ledger, stock and production by combining them into a true, single solution controlled through workflow, these new breeds of systems are set to transform how organisations plan and manage performance.
1.2 Transforming Planning into a Data-Driven Activity
A new generation of data-driven planning systems is beginning to emerge. These systems are very different from traditional planning systems and have an architecture that enables them to support the modern agile planning process. From a user perspective, they operate as a single management system where planning can be driven by events and exceptions in the business environment.
For example, a change in the competitor landscape may lead the system to collect more data for the affected areas, which leads to new initiatives being proposed, selected, and budgets changed accordingly. This can happen at any time and continuously.
To support this ‘data-driven' view, these systems have totally integrated capabilities for:
Business modelling
They support multiple data formats that link resources, workload and business activities to outcomes.
Methodology support
They fully support an organisation’s chosen strategy methodology and are able to directly link strategy with everyday activities.
Dynamic workflow management
They control how users interact with the planning models and can automatically trigger the allocation/adjustment of resources based on events and exceptions.
Adaptable security
They automatically restrict access through individual user profiles and involve people as required in the planning/review process through automated, personalised ‘To Do’ lists.
Initiative management
They enable the collection, assessment and approval of projects/initiatives focused on improving business processes and then go on to monitor their implementation.
Scenario Planning
They allow management to assess the impact of unknowable and uncontrollable events by simulating different business conditions and how they impact corporate goals.
Reports, analyses, scorecards and dashboards
They provide a range of report formats that are automatically distributed throughout the organisation based on individual responsibilities.
Rather than go through a detailed specification of all the capabilities required by a data-driven planning system, l am going to look at a notional modern FP&A system and focus on a few areas where its approach supports data-driven planning.
2. Data-Driven Planning Case Study
The good FP&A System supports the following:
2.1 Support for Multi-Cube Architecture
The FP&A System fully supports the planning framework outlined in this set of blogs. It allows users to create multiple models with different content and structures that operate as a single system.
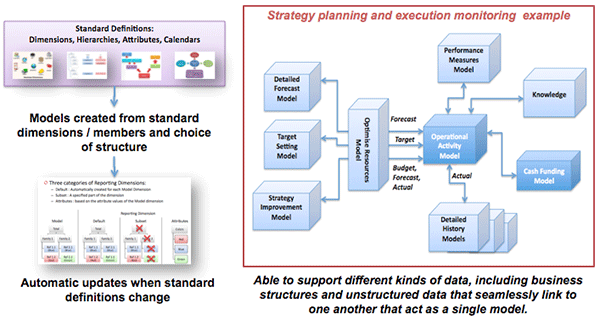
Figure 1
To simplify setup and maintenance, models are built from a standard set of definitions that define the current and future state of the organisation. These definitions include:
Business dimensions and members
This includes the traditional Business Intelligence dimensions of organisational departments, versions, products, channels, and so on.
Calendars
This is a special dimension where time is defined and used to hold data. In The FP&A System, this is not just a silo to hold data but a true date to which data is attached, which can be a particular date, week, month and any other passage of time. Data entered is then automatically consolidated to any span of time, e.g. months, quarters and seasons. This aggregation recognises how the business defines things such as holidays and weekends, which may vary between locations.
Hierarchy effective dates
Each business dimension can have multiple hierarchies that define how data will be consolidated for that dimension. E.g. how data is aggregated across divisions or departments. These hierarchy relationships can be given an effective “from” and “to” date so that when reporting results, consolidations can reflect:
- the current business structure,
- a structure from any given point in time and
- how relationships within a structure have evolved over time.
Models are built by selecting combinations of standard definitions to create one or more data models. Each data model represents a particular data grouping at the right, appropriate level of detail. For example, a sales forecast model would have details about salespeople, customers, products and an estimate of volume/price. A strategic initiatives model would consist of a cause-and-effect hierarchy that links initiatives with corporate objectives and contains details of milestones, resources and those responsible for delivery.
Each of the seven models outlined in this paper would be built in this way and then linked to each other, as well as a variety of external data sources where the raw data can be loaded. Where models are linked, data automatically flows between models, so there is no need to move data or manually set up data transfer routines.
As hierarchies and standard definitions change, their models automatically inherit those changes from the assigned date. In this way, data models need little or no maintenance, and the system ensures the integrity of results.
2.2 Intelligent Attributes
The second major area that makes the FP&A System different is something they call ‘intelligent attributes’.
Attributes are nothing new. They allow model dimension members, typically hierarchically organised, to be associated with an alternative grouping. For example, a member of the product dimension may be organised by product groups, but it could also, via an attribute, be associated with a particular colour or customer segment. This attribute can then be used to ‘filter’ the members of that dimension irrespective of where it fits in its hierarchy. For example, display all products that are ‘red’ in colour.
Intelligent attributes within the FP&A System take this a step further and allow models to be data-driven. To begin with, dimension members can be associated with multiple user attributes, which themselves can refer to existing dimension members. For example, they allow an individual measure to be associated with a type (e.g. objective, workload, resource, etc.) and particular dimension members, e.g. a specific strategic initiative and a specific number of departments.
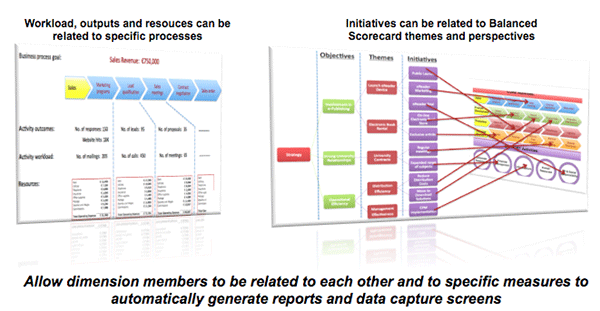
Figure 2
When it comes to reporting or providing data entry screens, intelligent attributes can be used to automatically select the right combination of dimensions and members for particular users without manually selecting them. This means only one report is required for all users and initiatives as attributes are controlling the content.
As more dimension members/initiatives are added to the standard definitions or changes made to the assigned attributes, reports are automatically reconfigured to present the right information to the right people.
2.3 Dynamic Workflow
Dynamic workflow is crucial for a data-driven architecture. In general, management processes are typically seen and implemented as six distinct processes: Strategic Planning, Tactical Planning, Financial Planning, Forecasting, Management Reporting, and Risk Management. However, these processes consist of several interconnected sub-processes that together form the basis for managing performance.
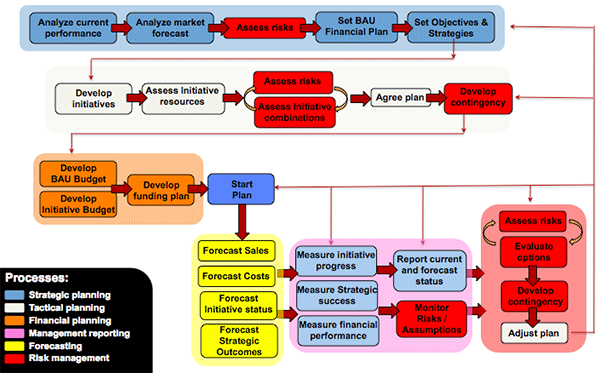
Figure 3: Performance Management processes combine to form a single process aimed at the execution of strategy.
Each sub-process is key to the management of the organisation – none can be left out. They need to be performed in a particular order, where each activity will connect with one (or a number) of the models within the planning framework by different parts of the organisation. Even within an activity, there may be interconnected tasks that each department has to perform in a specific order and at particular times.
For example, budgeting may start with setting a high-level goal (TSM) to which sales will decide how this will be delivered throughout the year (OAM). To do this, they may need to collaborate with marketing and production on particular initiatives (SIM) to achieve the goal. Once this has been completed, other areas of the organisation can start allocating resources that fit in with the sales and marketing plan.
Workflow is what controls user actions and ensures that things are done in the right order and at the right time. Most systems achieve this with a set of menus or preconfigured tasks that users work through. The problem is that this does not consider what happens if the data (e.g. a forecast) shows that something isn’t working and needs to be changed. That will rely on an administrator manually setting up a new workflow to cope with specific issues. Also, most systems only have a workflow for their particular application. What is required is a workflow capability that goes across all applications.
The FP&A System’s workflow is very different in that it covers the complete management planning/reporting cycle. It is driven by a combination of activities directed by an administrator as well as exceptions (e.g. the variance between the end-of-year forecast and the budget is greater than 10%) and events (e.g. a task has not been completed on time or a competitor has just announced a new product). In each of these cases, the FP&A System can reconfigure the workflow according to a set of rules, making the process dynamic but without administrators having to continually set up a new workflow.
The FP&A System’s workflow is created by an administrator’s 'drag and dropping’ a number of pre-built tasks onto a timeline. These tasks include information on:
Task trigger, i.e. what causes the task to start
This could involve multiple triggers, such as completing a previous task, a set date on the calendar, or a variance.
The department and person involved
This identifies those responsible for carrying out the task, which could include multiple people in multiple departments. For example, there may be a product manager for each product category who needs to review their area of responsibility. This activity could happen in parallel, but each would need to be completed before the start of the next task.
Planning model and data view
This describes the planning model to be accessed for each task and the ‘slice’ of data to be presented. Because models contain data for multiple departments that span various processes, it is essential that only the right people can access the right information at the right time. In some instances, users may need access to multiple models. For example, when reviewing performance, they may need access to the detailed history models to enable them to carry out detailed analyses and compare those analyses with data in the detailed forecast models before they come to any conclusions.
Processing required
Once access has been granted, users need to be directed to what they can do with the data. As mentioned in the last point, we may want to grant access so the users can perform their analyses. Similarly, we may want them to load their current forecast from an external file.
Action or output required
Tasks require an output. This could be a submission of data for approval, as in the case of entering a budget, commenting, following the review of actual results, or approving a submission, as in the case of creating a forecast. In most cases, the output will be compulsory, and so the expected format needs to be clearly explained. For data submissions, this should include the planning model and data slice that needs to be completed.
Completion notification
This final piece of information indicates when the task has been completed and is no longer available, which could include:
- when a particular action has been performed, such as the approval of a budget.
- a date or time. For example, forecasts can be entered up until the last day of the month, after which data entry will be blocked.
- a set condition. For example, budget submissions can be altered up until all submissions have been received.
- any combination of the above.
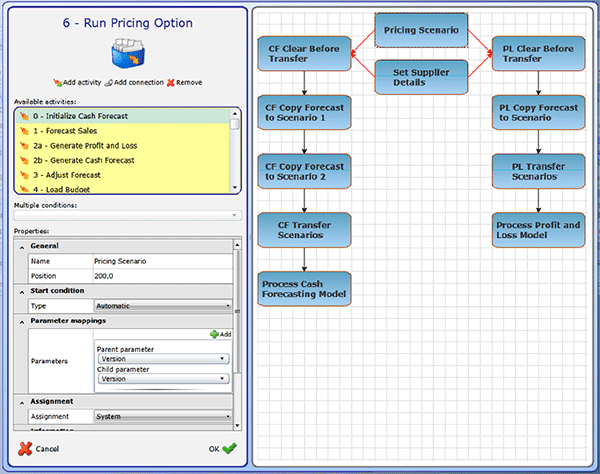
Figure 4
Once activated, this definition generates a timeline of activities and their status. This can be used by administrators to look out for bottlenecks in a process, as well as change priorities and send notes to those involved.
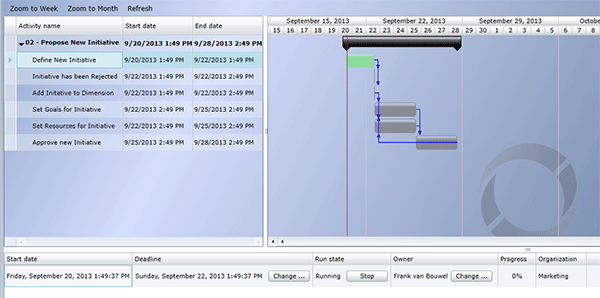
Figure 5: Workflow timeline showing allowable duration and status of activities
Users interact with the system via their own personalised ‘To Do’ lists that lead them through any actions they are required to perform.

Figure 6: The FP&A System provides each user with their own personal ‘To Do’ list
In this way, the FP&A System is able to support a continuous planning process that covers the seven planning models described in this paper.
2.4 Time-Shifting of Data
Planning is primarily concerned with the timing of actions. This is particularly true when considering the implementation of initiatives – when should they start, and how long should they go on for? But it’s also true for organisations whose work is project-based and where income and expenditure are dependent on milestones. In both cases, initiatives and projects represent a package of work and associated resources that cover a period of time.
For planning purposes, managers will need to know the impact of the delay. What happens if the project is put back by three weeks? What resources would we need if we brought forward some of the projects and cancelled others?
Because the FP&A System uses a true calendar and has inbuilt time-shifting capabilities, this type of analysis is easy to do. With a single command, the entire content of a project or initiative can be ‘moved’ in time, although its original start and end dates can be retained for comparative purposes. This delay can be expressed in days, weeks, and so on, with the FP&A System working out how this gets reported in terms of months or other reporting periods.
2.5 Integrated Reporting
Reporting is a vital component of any planning system, as through reports and analyses managers interpret results and take action. It should enable any type of report and allow access to data from anywhere in the planning framework, ensuring that only the right users can see the right data.
To support this, the FP&A System comes with its own reporting and analysis capabilities that include charts, grids, formal reports and specialised components for formats such as strategy maps. Reports and analyses can take data from one or more models. Most reports are defined as a combination of multiple simple reports that they refer to as blocks. Blocks can be positioned anywhere on a page whose ‘off-grid’ dimensions can be linked so that they act as one report.
The FP&A System enables any kind of report to be placed anywhere on a page.
Reports can contain data, notes and comments and the information about the process that generated the data. It can also include the data as it existed on any past date (the FP&A System keeps a full audit trail of all changes) and the structures used to produce consolidated results.
Reports can be combined into books that can be published in many formats, such as PDF, Excel, and HTML. Excel can also be used to report directly from a model.
3. Next Steps
Data-driven planning is fast becoming an essential requirement for organisations operating in today’s volatile, global business environment. It requires organisations to rethink how they manage their business processes and the way strategy is implemented and monitored, and it needs a modern architecture that transforms planning into a continuous data-driven process.
Relying on outdated management processes makes no sense and will cause organisations to fail in their quest. Similarly, inflexible, silo-based planning systems will slow down organisational decision-making and prevent organisations from reacting to critical external events.
It’s time to change. To let go of ineffective management practices and to embrace common sense supported by architectures designed for today’s business environment.
In terms of ‘next steps’, we suggest the following:
Clearly define the role of planning
Ask management within the organisation about the purpose of planning. This will naturally lead to a discussion about the future and where the organisation sees itself, which may be different depending on whether the short or long-term is being considered. One thing is for sure is that while the content and structure of the plan may differ, they should all involve modelling business processes. The short-term view will be focused on available resources and market opportunities with current business processes. In contrast, the long-term view is less constrained and can consider far-reaching changes to the same business processes.
However, both views are connected, as what happens in the short term will ultimately lead to what is achieved in the long term. Business processes are at the heart of both.
Decide on the network of planning models required by the organisation
For short-term planning to support long-term planning, organisations will require multiple models that operate on a common data set. That data will include historical trends and structures alongside short and long-term forecasts on both the market direction and the organisation’s capabilities. This network of models tells a story, and its theme – organisational objectives – provides an everyday basis for all.
We suggest you take the framework outlined in these blogs and map out the models your organisation needs. This doesn’t have to be in much detail, to begin with. The aim is to get agreement on the complete picture required, after which time can be spent on what content is needed for each model and how data is passed between them.
Assess the issues with the current planning process
Now we have a planning framework that is based on what the business needs. The next step is to assess the current planning models and processes. How well do they fit as to what is really required? What effort is required to link them together (if at all), and how well do they connect the organisation around the topic of strategy execution?
As part of this review process, highlight weak (or missing) areas and what it would mean for the organisation if those areas were fixed.
Discuss your findings with colleagues
Change does not happen overnight. In our experience, it takes many years as change involves changing culture – i.e. how things are done. Making the change being proposed in this paper requires senior management commitment and a general consensus among operational managers that this is not only worthwhile but essential for the organisation’s future.
An attempt should be made to set priorities – e.g. what planning models need to be addressed first and how the process can be conducted (or triggered) on a continuous basis.
Partner with a vendor offering a data-driven planning solution
Lastly, a modern planning system is essential in bringing organisations together that can communicate with individual managers on their roles and that can easily adapt to a constantly changing business environment.
The systems mentioned in these blogs are not common. Carefully describe to a potential vendor your vision for planning and the capabilities that are required. You could use our paper to explain how such a network of models holds different data but needs to work as a single system.
Get vendors to outline their vision for their solutions and how they would meet your requirements. Then contrast the investment required and how this compares with the benefits that such a solution would bring.
Subscribe to
FP&A Trends Digest

We will regularly update you on the latest trends and developments in FP&A. Take the opportunity to have articles written by finance thought leaders delivered directly to your inbox; watch compelling webinars; connect with like-minded professionals; and become a part of our global community.


Kirkal
December 5, 2023