For many years, we have been hearing about challenges with data from our members. Phrases such as “We are poised by bad data” could be heard from our members across the globe. According to our 2025 FP&A Trends Survey, nearly half of FP&A time is wasted on curating data. In our opinion, these data challenges are solvable. In June 2025, we presented the 36th London FP&A Board and decided to share our view on how to solve these data challenges.
This Board session was sponsored by Revelwood, with continued support from Robert Walters and IWG plc. It brought together senior finance leaders from organisations including AmexGBT, Warner Bros Discovery, Capita, Vodafone Group, GSK, Cleveland Clinic, Publicis Groupe, Santen UK Ltd, PlayStation and others.
Larysa Melnychuk, CEO and Founder of the FP&A Trends Group, welcomed the finance leaders and provided a brief overview of the history, mission, and objectives of the International FP&A Board. The session was co-facilitated by Tanbir Jasimuddin, FP&A Trends Author and a leading expert in data strategy.
1. Information and Data Strategy
The foundational first step in mastering FP&A data is to build an information strategy. We asked the audience how many of their organisations had clearly articulated information strategies. No hands were raised. However, a handful had a ‘looser’ view that they could work with. We cannot emphasise enough the importance of the information strategy. Proceeding with any analytics initiative without this is like putting your head through a window, without opening it first.
An information strategy defines the information that an organisation needs to achieve its strategic objectives. We discussed the three activities to help build your information strategy.
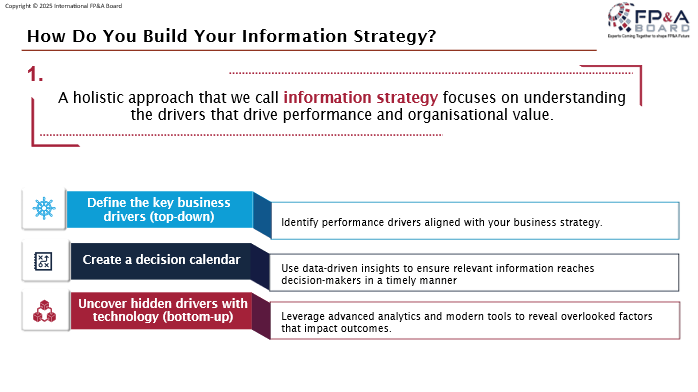
Figure 2
Firstly, we review the organisation's value drivers to define the KPIs and measures that will signpost the performance of those drivers. Alongside this, we create a ‘decisions calendar’ that analyses the key decisions taken within the organisation, who makes those decisions, and when. We then define the information needed to support those decisions.
Whilst this gives us a very good starting point, this is very much a hypothesis-driven, top-down approach. Numerous hidden drivers of performance are not always known. To uncover these, we can undertake a bottom-up analysis to look for previously unknown correlations. We explored techniques such as covariance matrices.
These activities will clearly highlight the most critical information that an organisation needs. This exercise will typically yield two major advantages over jumping straight in.
- You will build a more streamlined platform with only the most relevant information. It will be considerably quicker to build and simpler to maintain
- You will have a roadmap of information that you need to collect to support your strategic objectives
Too often, we see organisations jump into their analytics transformation before completing this step. Consequently, they will build a platform with every permutation possible with existing data. They will also miss key information, with no plan to collect this.
2. Data Strategy
The data strategy is the technical approach to deliver the information strategy. It is about
- How to capture the data needed from the source
- How to cleanse and make the data usable
- How to store the data
- How to ‘enrich’ and ‘model’ the data
- How to present the data to the users
3. The Components of the Modern FP&A Stack
We started this section by discussing the traditional FP&A stack. We noted that while we defined this as ‘traditional’, for the majority, this is still aspirational:
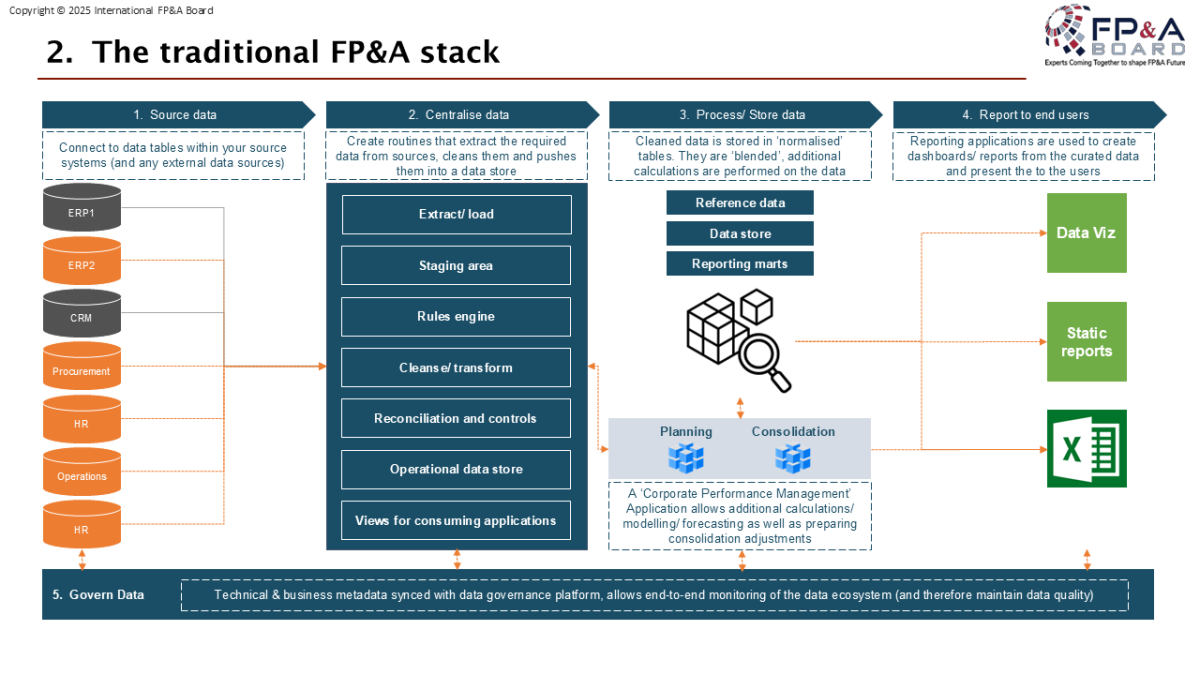
Figure 3
There have been some significant advances in the technology stack over the last few years. We discussed where the best-in-class architecture is heading and presented our view:
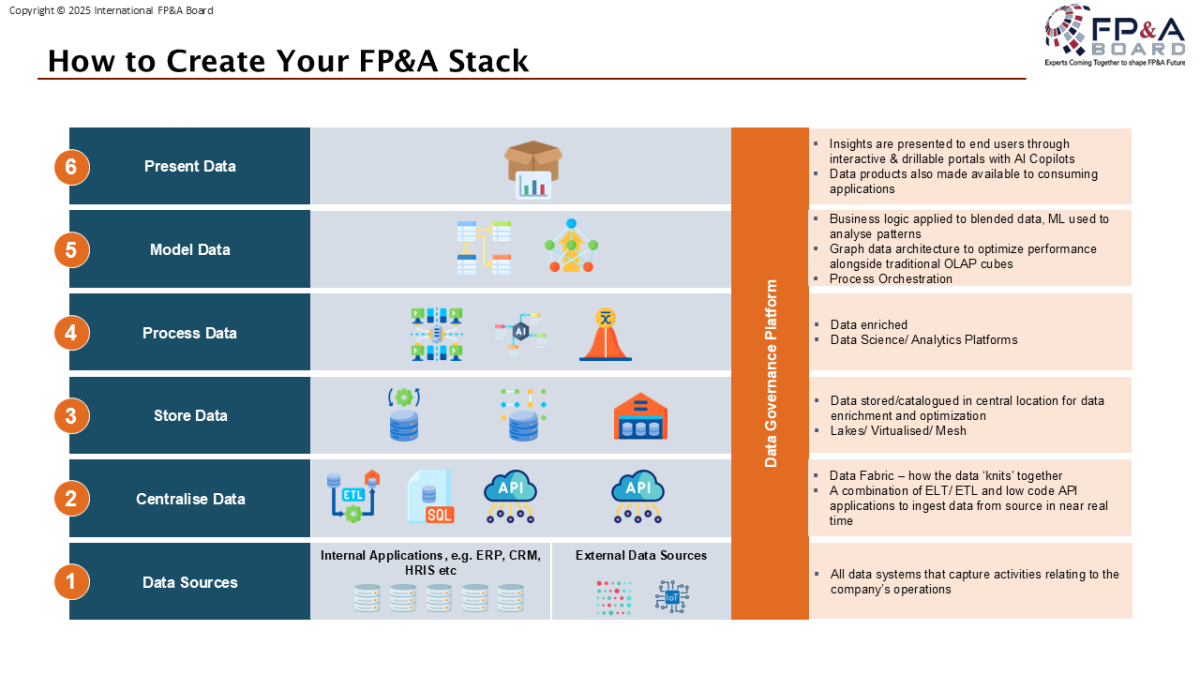
Figure 4
The key differences are blending internal and external data sources, using data science platforms to experiment and perform AI/ML, greater scalability and the ability to process greater data volumes through ‘Graph Databases’ and an AI interface to surface key insights.
We also discussed the impact of LLM-AI on this stack. We’ve arranged it to show the user interface on the top, and it gets more technical as we go down. LLM-AI is making more of the stack accessible to the business user, whereas traditionally, they would not go beyond the top interface layer.
4. Data Governance and Data Quality
Only 17% of our survey respondents have achieved the mythical ‘single source of truth’.
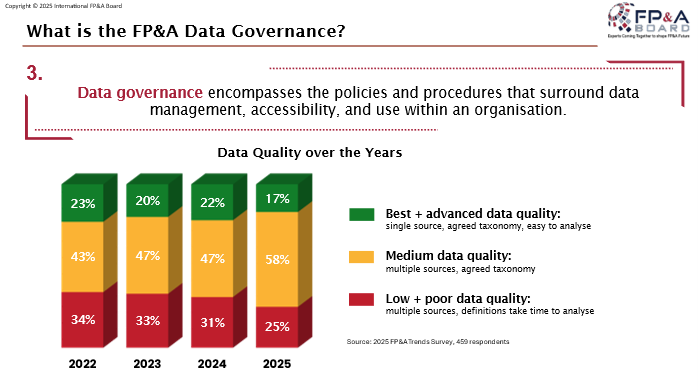
Figure 5
To achieve adequate data quality, you need to govern your data. Data governance encompasses the policies and procedures surrounding data management, accessibility, and use within an organisation.
We presented five steps to achieve this:
Define accountability for data – carve out the data landscape into data domains and assign a ‘business data owner’. We discussed the importance of the business data owner being the functional expert, NOT FINANCE. For example, the Chief Marketing Office is better placed to understand the nuances of NPS, sentiment analysis, and churn than anyone in finance
Define the data organisation (i.e. centralised vs decentralised) and the role of the Chief Data Officer within
Define your golden record – for each data object, you can only have one source system for entry (with data entry validation). Without this, you will suffer from inconsistent data quality
Catalogue your data and define the lineage so that you have a full understanding of what you have got and how data changes as it is processed through various systems before being presented to the end user
Define your data quality processes to monitor and clean data continually
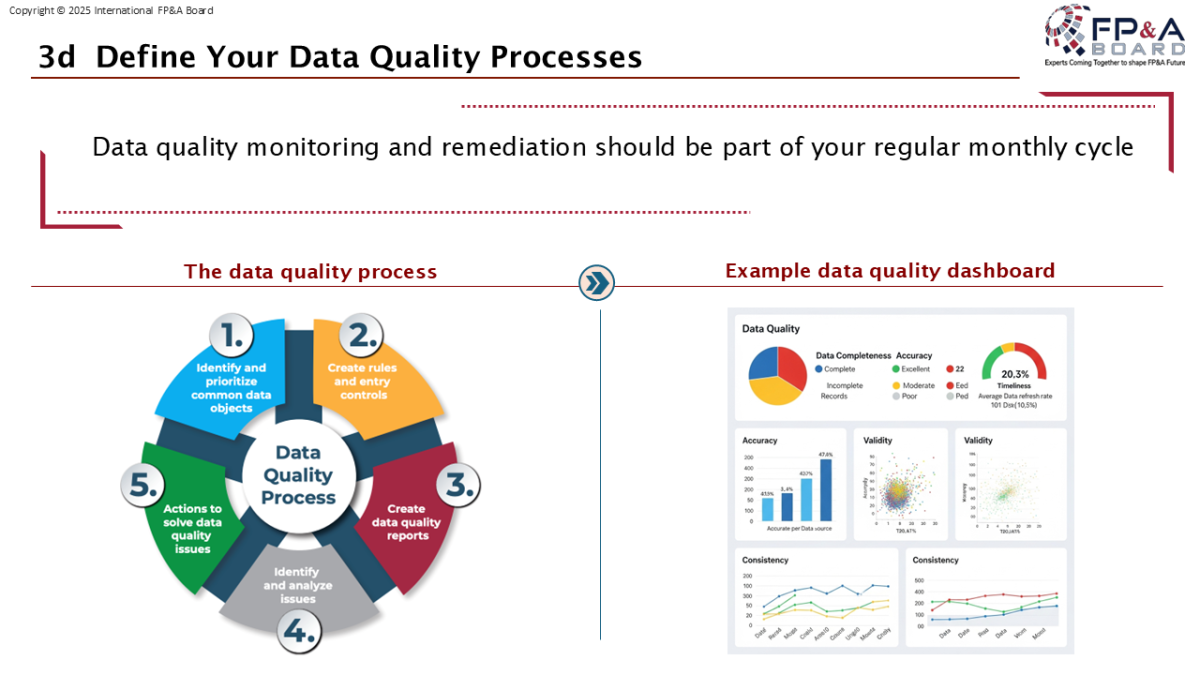
Figure 6
5. The People Side of Analytical Transformation
Of course, no initiative will be successful if you do not spend the majority of your efforts on aligning people and building their capability. We discussed how building data literacy and data culture was critical to success here. We discussed how the emerging FP&A roles of an FP&A data scientist and an FP&A architect were helping embed the changes.
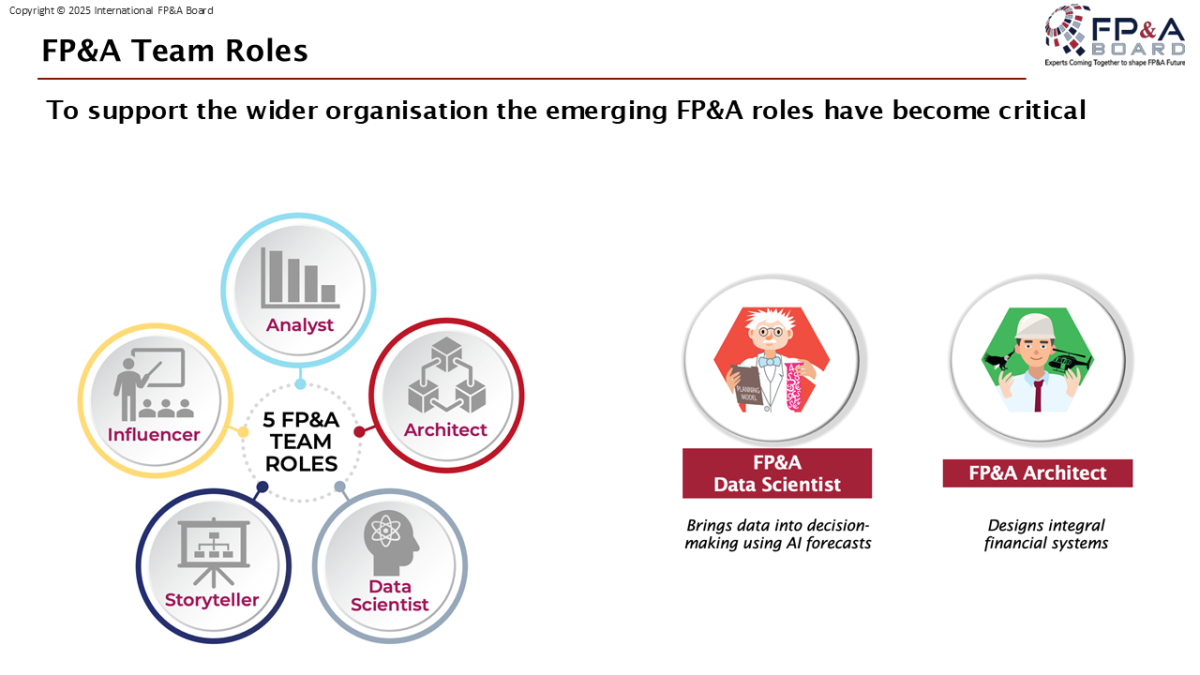
Figure 7
We also discussed ensuring that the technology progress moves at the same speed as the improvement in data capability across the organisation – if the tech moves too fast, you will not get adoption; if the tech is too slow, you will get a frustrated group of stakeholders.

6. Conclusion
It was a thoroughly insightful evening with some amazing contributions from the audience, sharing their knowledge, their expertise and more importantly, what they have learned from their failures.
Data is a topic that we all must master. The frameworks we have presented will allow FP&A professionals to drive their organisations forward.