
Usually I am fairly rational and do not let my personal emotions interfere with how I interact with others. However, as the readers of my blogs and articles may have detected, my more recent writings increasingly reflect my frustrations with old school accountants.

FP&A Insights
FP&A Insights is a collection of useful case studies from leading international companies and thought leadership insights from FP&A experts. We aim to help you keep track of the best practices in modern FP&A, recognise changes in the ever-evolving world of financial planning and analysis and be well equipped to deal with them.
Stay tuned for more blogs and articles from great authors.
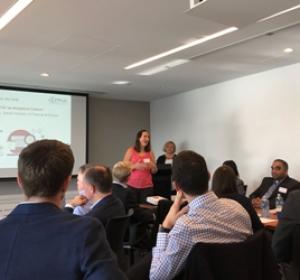
Another successful FP&A Board was held in Sydney on 21st August 2018, where more than 50 FP&A practitioners attended and discussed their challenges and trends in Financial Planning and Analysis.

Welcome to this blog series, where I look forward to share with you some of my reflections on what I believe are very important issues for most organisations today.

Are your KPIs, Scoreboards and other metrics safe from the Simpson's paradox?
+
Subscribe to
FP&A Trends Digest
We will regularly update you on the latest trends and developments in FP&A. Take the opportunity to have articles written by finance thought leaders delivered directly to your inbox; watch compelling webinars; connect with like-minded professionals; and become a part of our global community.