There are three critical roles in every balanced FP&A Team: the Architect, the Analyst, the Story Teller. How balanced is your FP&A organisation?
FP&A Insights
FP&A Insights is a collection of useful case studies from leading international companies and thought leadership insights from FP&A experts. We aim to help you keep track of the best practices in modern FP&A, recognise changes in the ever-evolving world of financial planning and analysis and be well equipped to deal with them.
Stay tuned for more blogs and articles from great authors.
The 19th London FP&A Board was debating about Zero Based Budgeting (“ZBB”). One of the key questions was if companies see a new Era for ZBB. The meeting was well attended and was a great success.
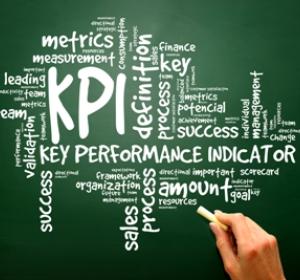
Key Performance Indicators (KPIs) are metrics that represent how various drivers of the business are performing. These drivers are often both financial and operational in nature. And while there is no one-size-fits-all when it comes to choosing the "right" metrics for your business it is critical that the data used be consistent and accurate.
FP&A establishes the foundation for thinking and learning about how processes affect outcomes. These actions can be guided by broad and narrow framing. In order for FP&A to add value toward these actions, it must take an active role in establishing a framework through the chart of accounts.
Pagination
Subscribe to
FP&A Trends Digest

We will regularly update you on the latest trends and developments in FP&A. Take the opportunity to have articles written by finance thought leaders delivered directly to your inbox; watch compelling webinars; connect with like-minded professionals; and become a part of our global community.


