
Although Beyond Budgeting is about so much more than just budgets, our name tends to draw...

Why Cost Volume Profit Analysis (CVP) Should Be a Main Step in Your Annual Profit Plan?
August 21, 2019
 Traditional budgeting process normally starts with forecasting sales levels, cost of goods sold then all operation expenses until reaching to the proforma income statement without understanding how changes in costs (both variable and fixed) & sales will affect profits in future periods. But modern FP&A professionals started to implement CVP analysis during the annual profit plan to study the interaction of sales with variable & fixed costs on the profits received.
What's Cost Volume Profit (CVP) Analysis?
CVP analysis is a planning tool that management uses to predict the volume of activity, costs incurred, sales values, and profits received. In CVP analysis, we are looking at the effect of three variables (Costs, Sales volume & Sales Price) on one variable "Profit".
CVP Analysis Steps:
- Classify costs & identify contribution margin.
- Calculate the break-even point in units & dollars.
- The margin of safety & Target income calculations.
- Using CVP analysis model for Sensitivity Analysis.
Classify costs & identify contribution margin:
CVP analysis classifies all costs as either fixed or variable. Fixed costs are expenses that don’t fluctuate directly with the volume of units produced/sold. An example of a fixed cost is rent expense for a retail store. It doesn’t matter how many units will be sold in the store. The rent expense will always be the same.
On the other hand, Variable costs change with the levels of production/sales. These costs include materials and labor that go into each unit produced. For example, the cost of PCs sold in a retail store is considered as variable cost; the more units sold, the more PCs cost will be.
Contribution Margin: the unit contribution margin is the selling price of a product minus all variable costs incurred to produce or sell this product. It measures the amount of the selling price of a unit that is used to cover fixed costs for this unit.
- Unit Contribution Margin (UCM) = unit selling price - unit variable cost.
- Contribution margin % = UCM / Unit selling price.
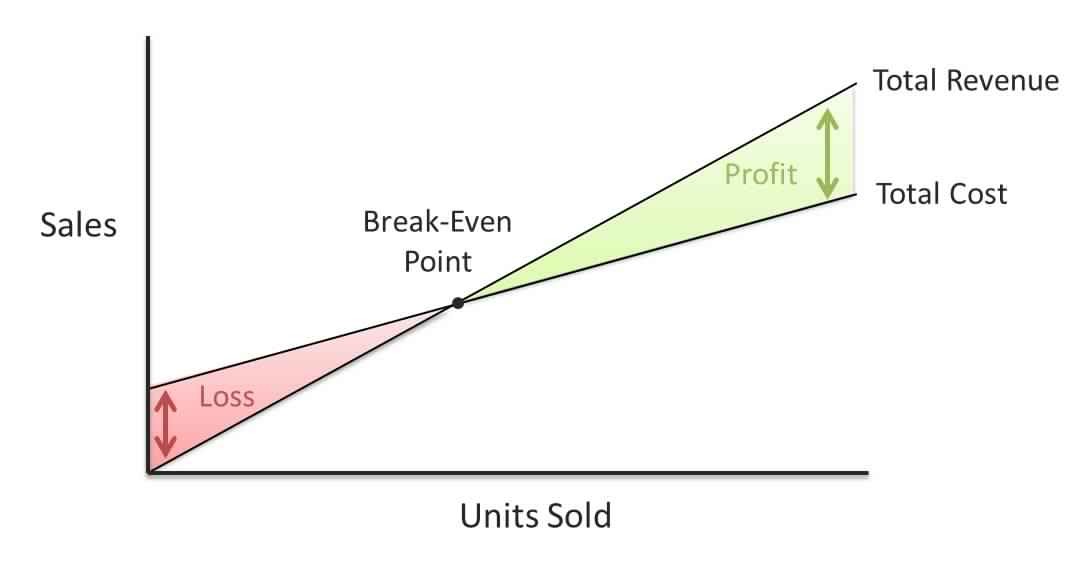
Calculate the break-even point in units & dollars:
Simply: the break-even point is the sales level where total revenues equal total costs. But the main thing that you must understand in break-even analysis is the difference between revenues and profits. Not all revenues result in profits for the company. Many products cost more to make or sell than the revenues they generate. Since the expenses are greater than the revenues, these products great a loss not a profit.
The purpose of the break-even analysis is to calculate the amount of sales that equates revenues to expenses and the amount of excess revenues, also known as profits, after the variable & fixed costs are met.
- Break-even point in units = Total Fixed Cost / Unit contribution margin (UCM).
- Break-even point in dollars = Fixed Costs / Contribution margin %.
Margin of safety & Target income calculations:
Margin of safety is the excess of budgeted sales over break-even sales. It's the amount by which sales can decline before losses occur.
Margin of safety = Planned Sales - Break-even sales*
Margin of safety % = Margin of safety / Planned sales
*Break-even sales means the sales amount that achieves the break-even point.
Target Income Calculations:
Target income sales can be measured in CVP analysis based on Target Operating Income or Target Net Income (the variance mainly depend on that tax rate in each country). Let's focus here on Target Operating Income.
Target Income Sales is the amount of sales needed to cover all variable & fixed costs plus the target income. Target income is the operating income that a company wants to achieve during a specific period.
Target Income sales in units = (Fixed Costs + Target operating income) / UCM
Target Income sales in $ = (Fixed Costs + Target operating income) / contribution margin %.
Using CVP analysis model for Sensitivity Analysis:
CVP analysis model can be used for a single product, multiple products & service companies as well to perform sensitivity analysis (also called what-if analysis).
Sensitivity analysis shows how the CVP model will change with changes in any of its variables (fixed costs, variable costs, sales price, or sales mix). The focus is typically on how changes in variables will affect profit.
Finally, sensitivity analysis can be used in break-even & target income sales calculations because it offers different scenarios whether by increasing sales, reducing variable cost or even cutting down the fixed cost. FP&A professionals rely on Microsoft Excel so much to perform CVP & sensitivity analysis models.
The full text is available for registered users. Please register to view the rest of the article.
Related articles

One of the realities that FP&A professionals need to realize is people tend to be too...

One can find many definitions of financial analysis. Investopedia defines financial analysis as “the process of evaluating...

Scenario analysis, sensitivity analysis and what-if analysis are very similar concepts and are really only slight...

Following on from the success of the 21st London FP&A Board, we had the pleasure...

A proper financial model that provides quick answers to different changes will help you make your...
+
Subscribe to
FP&A Trends Digest
We will regularly update you on the latest trends and developments in FP&A. Take the opportunity to have articles written by finance thought leaders delivered directly to your inbox; watch compelling webinars; connect with like-minded professionals; and become a part of our global community.