
Financial models are crucial to the business but building them in Excel can be both complicated...

Quantitative Modelling and Simulation for Strategic Financial Planning
November 26, 2020
 Contrary to short-term budget planning or planning for a specific financial task, strategic financial planning plans for the ultimate goal of a company - avoiding the path to bankruptcy and striving for a sustainable growth rate.
Strategic planning is mainly done with qualitative analysis. In this article, we will explore the use of quantitative tools, how to narrow down the number of variables to focus on and what tools can help with managing multiple scenarios.
The challenge of building action-based models for strategic planning
As I discussed in the previous article Why 3-Statement Forecasting Is Not Enough, the basic step (or unit) of a financial model should not be a time step (annual, quarter or month) but permissible actions that occur in real business life (borrowing and paying down debt, buying and selling inventory…). The model should be capable of computing deterministically the outcomes (balance sheet and income) given a specific input of the future actions.
The following two charts show an example of a forward balance sheet and income statement under one specific set of future actions computed by an action-based dynamic model. Note that the end of a company (bankruptcy) can be modelled naturally as when the cash level becomes negative.
Chart 1. Action model balance sheet projection (only showing major items. Bankruptcy occurs in 2026 in this projection)
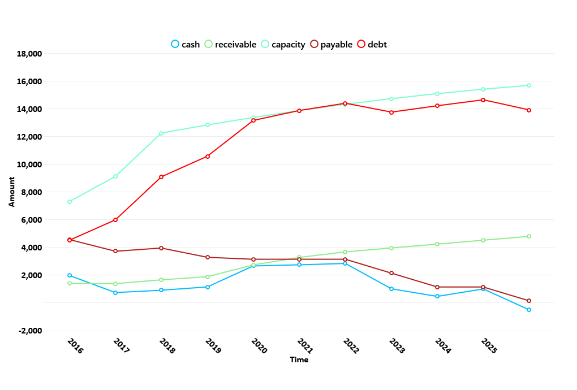
Chart 2. Action model forward income statement
The challenge in applying this deterministic model to strategic planning lies in the astronomical number of possible combinations of future actions. Even a simple action-based model may have over 30 actions with 50 to 100 variables, each being a time series over the planning horizon, leading to an unmanageably large number of inputs to the model.
The impact spectrum helps to narrow down the number of variables to focus on.
Impact spectrum: addressing the action-based modelling challenge
An impact spectrum is a tool that finance professionals can use to shift each action variables relative to a baseline and compare the change in a chosen outcome.
In a dynamic model, action variables are equivalent to input variables or impact variables. For models fully driven by company fundamentals, an impact variable can be any variable that specifies a financing or operating action – the amount of new debt in the action of borrowing, the percentage of current inventory sold in the action of selling, the tax rate in the action of paying income tax, etc. The outcome variables are what the models predict or simulate, which are essential to all the items on a balance sheet and income statement.
In the example below, there are two possible outcome variables 1) the time to bankruptcy and 2) the growth of cash level over the projection horizon (in case no bankruptcy happens). One can certainly choose other outcome variables such as total growth of sales etc.
“Bankruptcy” is defined as when a company’s cash position becomes negative. It is also referred to interchangeably as “default” in this article.
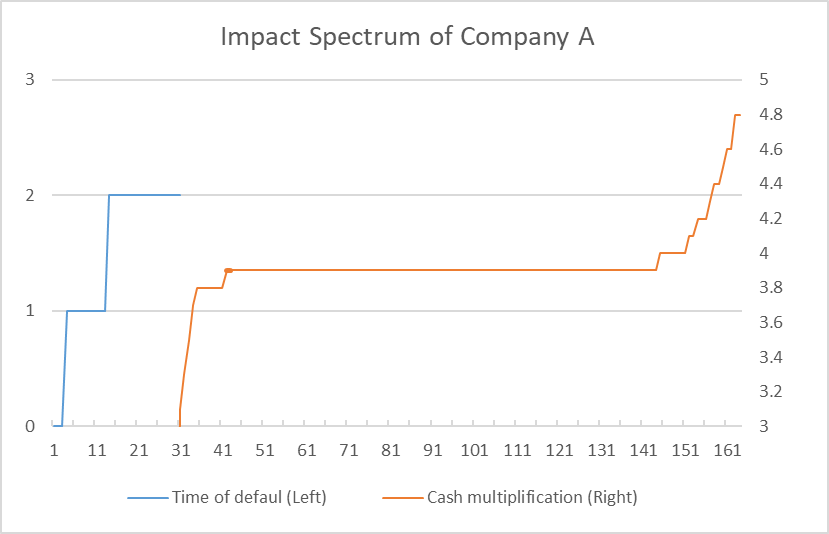
Chart 3. Sample impact spectrum
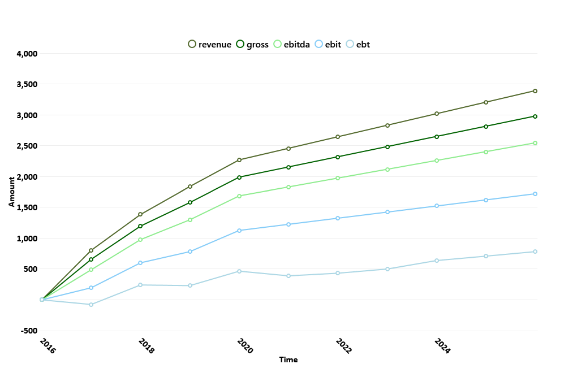
Chart 3 shows an example of a company’s impact spectrum that covers a 20-year horizon. There are, in total, over 160 impacts from over 80 variables (each variable giving two impacts – up and down in value). The impacts are sorted from left to right in the order of the most negative to the most positive impact.
The red curve shows how much cash has multiplied (right scale) over the projection period in the case without bankruptcy, and the blue curve shows the years to bankruptcy, or default (left scale) if the company does go bankrupt. The solid dot is the baseline case.
Note that a large number of impact variables (impact #40 to #140) make practically no impact on the chosen outcome. Some impact variables (#140 to 160) make positive impacts, while some others (#1 to #40) make a negative impact.
Monte-Carlo simulation as a way to manage various scenarios
The impact spectrum helps to narrow down the number of impact variables to focus on. But even with this help, there are still too many possible future scenarios to go through one by one. This is where Monte-Carlo simulation can be of great help.
In my modelling approach, there are three levels of Monte-Carlo simulation, each becoming more realistic than the last but also requiring much longer computing time.
1. Correlated statistical Monte-Carlo
The most basic Monte-Carlo method treats each selected impact variable as a stochastic variable following a certain random process. The random processes, not necessarily always Gaussian, can be derived either from the company’s historical data or from a larger set of industry data. Different impact variables may be assumed to be correlated with one another.
In the example below, a Monte-Carlo simulation is made over a 20-year horizon. Chart 4 shows the annual percentage of bankruptcy scenarios (cumulatively, the company has bankrupted in 90% of the cases), and Chart 5 shows the histogram of sales growth in the cases without bankruptcy.
The company can drill down each case of outcome and find the actual values of the underlying impact variables leading to either the most undesirable or the most desirable outcome, such as in Charts 6 and 7.
Chart 4. Annual percentage of bankruptcy
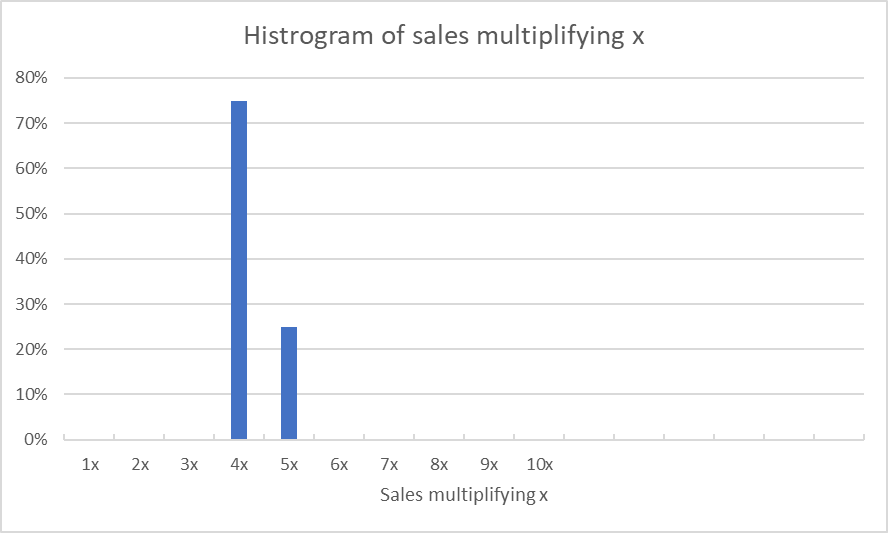
Chart 5. Histogram of sales growth within non-bankrupt cases
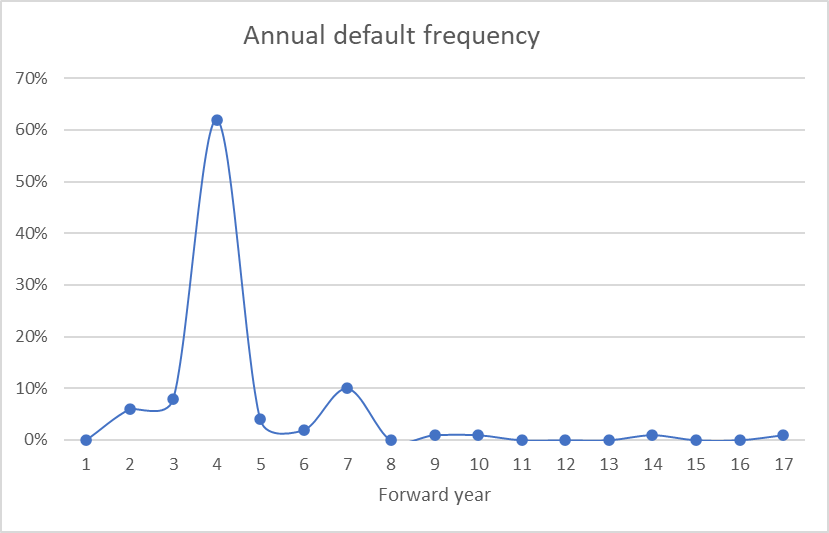
Chart 6. A set of impact variables (new debt, new CAPEX, and sales ratio) leading to bankruptcy at year 7
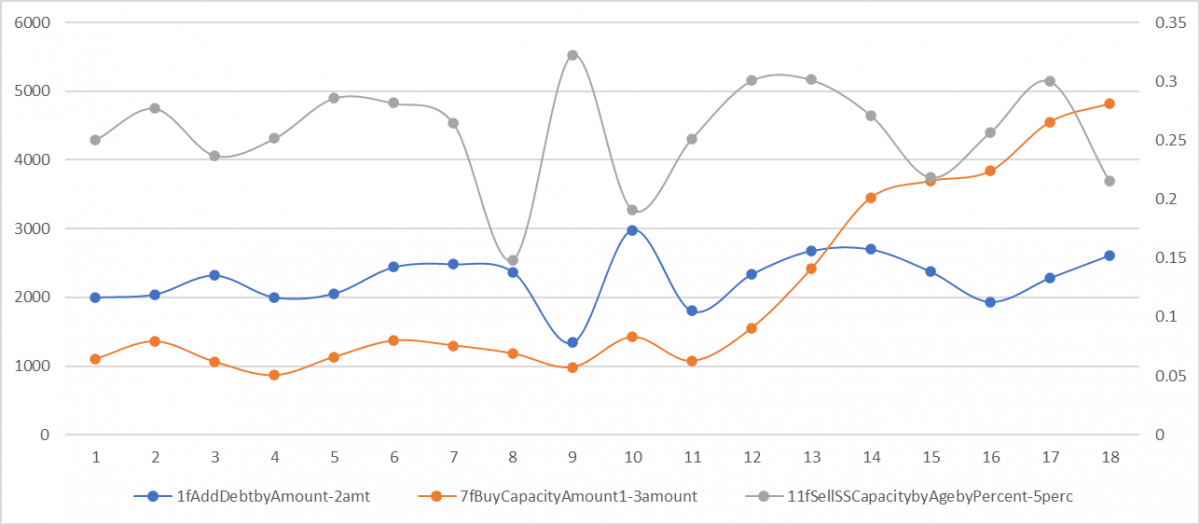
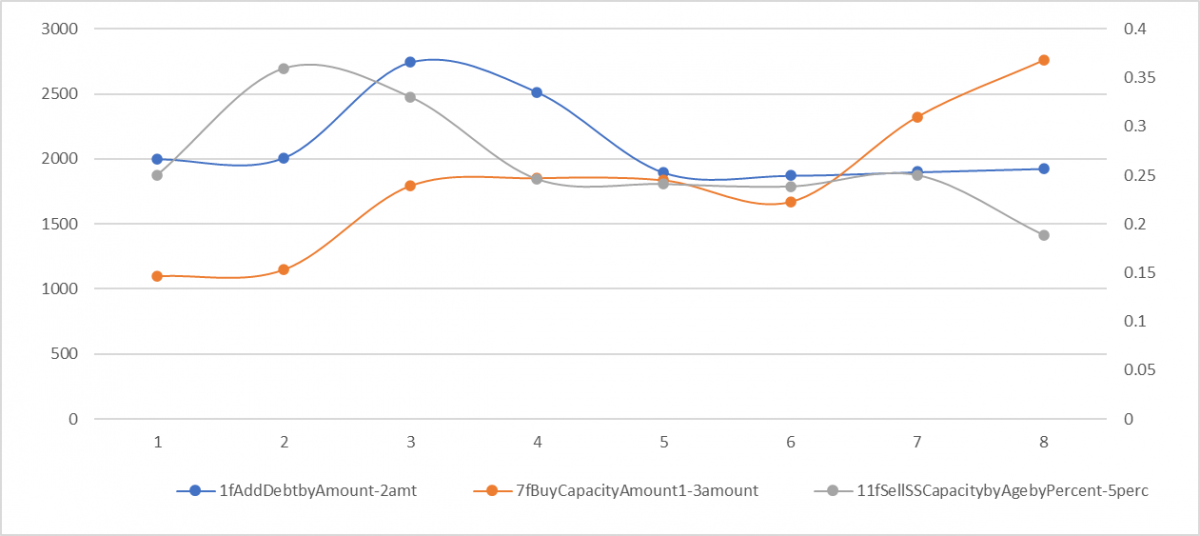
Chart 7. The same set of impact variables leading to growth without bankruptcy.
2. Self-optimising Monte-Carlo
The standard statistical Monte-Carlo is not the most realistic simulation because not every impact variable is stochastic. For example, the level of new capital expenditure each year. In reality, the level is decided based on strategic goals and financial projections made at the time. Therefore, in a more realistic simulation, the values of certain impact variables are determined by the values of the realised values of the stochastic variables, as well as a set of goals and optimisation rules. In other words, they are self-optimising.
In this case, the company from the last example is simulated again with two self-optimising variables (new debt borrowing amount and new CAPEX amount), each trying to achieve two goals at each forward time step:
- avoid bankruptcy within a 5-year projection period, and
- given that (1) is true, increase the sales growth rate to a prescribed level over the same period.
To achieve these goals, the simulation must perform another mini-simulation at each time step.
In a self-optimising Monte-Carlo model, the number of bankruptcy cases is significantly reduced (chart 8). The cumulative bankruptcy percentage is reduced from 90% to 18%. Interestingly, the distribution of sales growth realised in the surviving cases (chart 9) is similar to the ones in a standard statistical Monte-Carlo model. Importantly, the manager can now see how the self-optimising variables respond to stochastic variables to achieve the preset goals (chart 10), in what scenarios the responses did and did not work, what improvements may be applied to the goals, etc.
Chart 8. Annual percentages of bankruptcy cases are significantly reduced. Only 18% cumulative bankruptcy over the projection period.
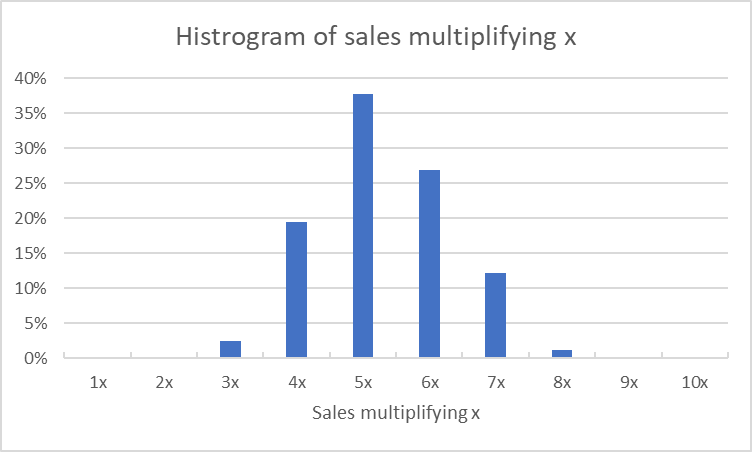
Chart 9. A similar distribution of sales growth among cases without bankruptcy as in the statistical Monte-Carlo
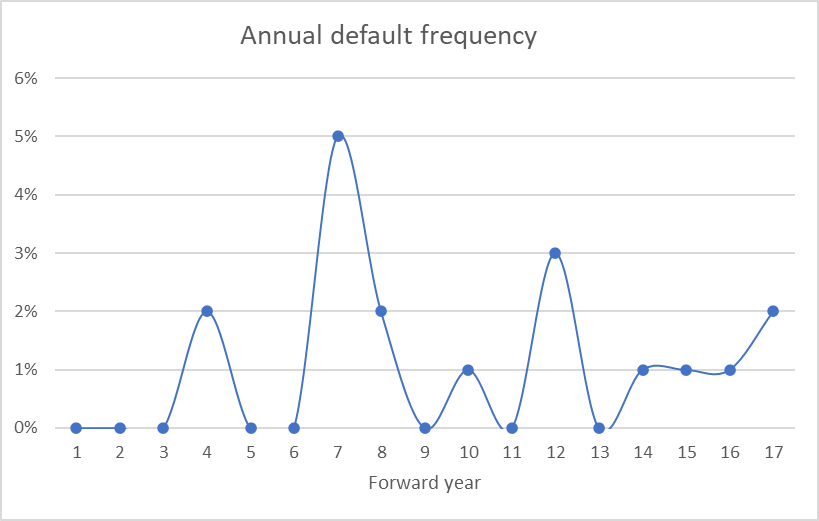
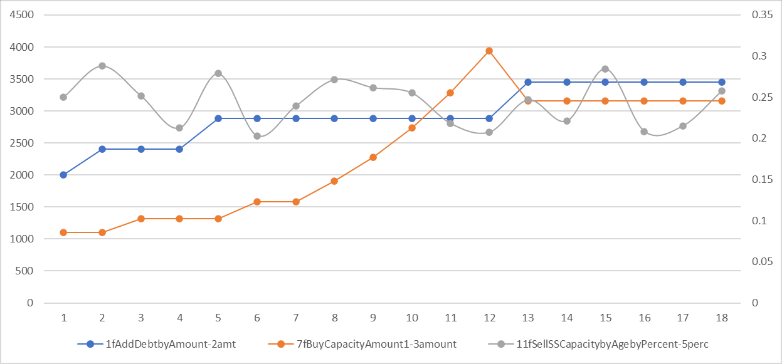
Chart 10. Examples of self-optimising impact variables that avoid bankruptcy and optimise growth. The level of CAPEX (orange, left scale) and the level of new debt (blue, left scale) cease to be random but self-adjust in response to the random sales ratio (grey, right scale).
3. Checked self-planning Monte-Carlo
The self-optimising Monte-Carlo model seems to be smarter than purely statistical Monte-Carlo. Can it be too smart? Yes. In reality, a company does not have complete control over executing its planning. For example, a company may come up with a planned level of new borrowing, but it has to be accepted by the bond investors whose appetite for debt is uncertain.
In this case, the resulting value of an impact variable is the minimum of the planned level and the acceptable market level. In the interest of not going too long in my article, I won’t discuss it further. If anyone is interested, please get in touch with me for more details.
Summary
- A dynamic (causal) model that is fully driven by fundamental actions is the basis for quantitative strategic planning.
- A causal model normally comes with an enormous number of input (impact) variables that must be narrowed down using static scenario analysis (sensitivity or impact spectrum).
- Monte-Carlo simulation is a standard technique in finance, but for strategic planning, Monte-Carlo implemented with self-optimising variables are essential in producing realistic results.
The full text is available for registered users. Please register to view the rest of the article.
Related articles

As long as there are humans involved in making a forecast, the forecast will be biased...

This article will discuss how financial planning and analysis (FP&A) professionals can determine the general market...

This article will focus on is the modeling of a company as a whole, its consolidated...

Starting with the end in mind is one of the simplest ideas that is frequently ignored...

Scenario analysis, sensitivity analysis and what-if analysis are very similar concepts and are really only slight...
+
Subscribe to
FP&A Trends Digest
We will regularly update you on the latest trends and developments in FP&A. Take the opportunity to have articles written by finance thought leaders delivered directly to your inbox; watch compelling webinars; connect with like-minded professionals; and become a part of our global community.