In this article, the author, an experienced FP&A veteran, focuses on the seamless integration of supply...

Introduction
The bullwhip effect, or Forrester effect, was first introduced by Jay Forrester in 1961 at the Massachusetts Institute of Technology (MIT) and indicates the increase in demand variability as one moves up the supply chain.
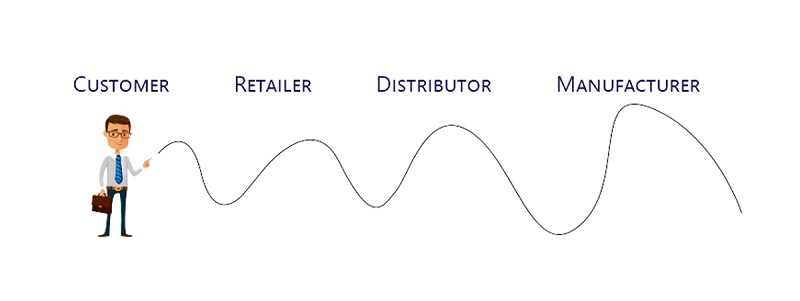
This term also refers to the fluctuation of the entire supply chain in relation to consumer demand. Therefore, the final consumer holds the whip in his hands, and a small variation is being caused by his needs. That results in a series of fluctuations that affect the entire supply chain with greater amplifications.
The bullwhip effect is a major concern for many manufacturers, distributors, and retailers. The increased variability in the ordering process requires each facility to increase its safety stock to maintain a certain level of service. Consequently, it may result in increased costs due to overstocking throughout the system and can lead to inefficient use of resources, such as labour and transportation.

Figure 1: The Visualisation of Bullwhip Effect. Source: Arkieva Blog.
Causes of Bullwhip Effect
In general, four to five inventory points separate the end consumer from the producer. Each of the actors involved tends to protect its production or sales activity by increasing its inventory to cope with possible fluctuations in demand at each stage.
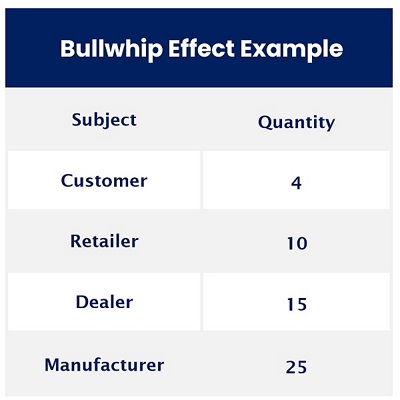
I would like to outline a simple example to help you understand the core of this concept. For instance, a consumer decides to buy four size XL T-shirts. But unfortunately for him, the T-shirts are no longer available. Therefore, to satisfy this demand, a retailer decides to place an order for 10 units from its dealer to ensure they have more T-shirts in stock. As a result, the dealer will decide to order 15 units from the manufacturer to cover any additional orders.

Figure 2
Finally, the manufacturer will be able to produce a minimum of 25 T-shirts due to the break-even point or production constraints. So, in this simple case, we can see the amplification of the order from the lowest to the highest level of production. Simultaneously, production becomes about 6 times larger than the customer's requirement. What are the reasons behind it? We can now quickly examine them.
1. Price Fluctuation
It occurs because retailers and distributors desire to sell the largest possible quantity of products. At the end of the promotional period, there is generally a phase of contraction in demand when the product is sold only in low quantities. This phenomenon is referred to as the boom-and-bust cycle. If this market situation has not been accurately considered by the forecast, it can generate a significant and immediate whiplash effect.
2. Order Quantity
The ordering system sent by the consumer to the producer often "suffers" from continuous rounding and adjustments of various kinds: minimum production batches, economies of scale, production constraints, minimum quantities of break-evens, etc.
3. Market Demand
The forecast of the market or the relevant sector is often carried out using the data concerning the previous year with applied percentages indicating the increase or decrease. This aspect contrasts with a market situation generally different from prior periods due to endogenous and exogenous phenomena influencing demand.
4. Communication
The lack of communication generates delays in the actions to be taken, a lack of timely updates and anomalous operations concerning the condition of the market. Failure to use effective communication causes an unwanted whiplash effect.
5. Return Policies
These can certainly generate ripple effects since many companies (distributors and retailers) may take advantage of returning the unsold product to the manufacturer. In this case, the supply of the distributor and retailer is usually always higher than the market's needs due to the concession of the returned product.
6. Delivery Times
Delays in delivery times cause anxiety and panic among the recipients. In this case, it is preferable to order, when possible, a higher quantity to meet market demand. This reason inevitably generates fluctuations that spread towards the primary supplier.
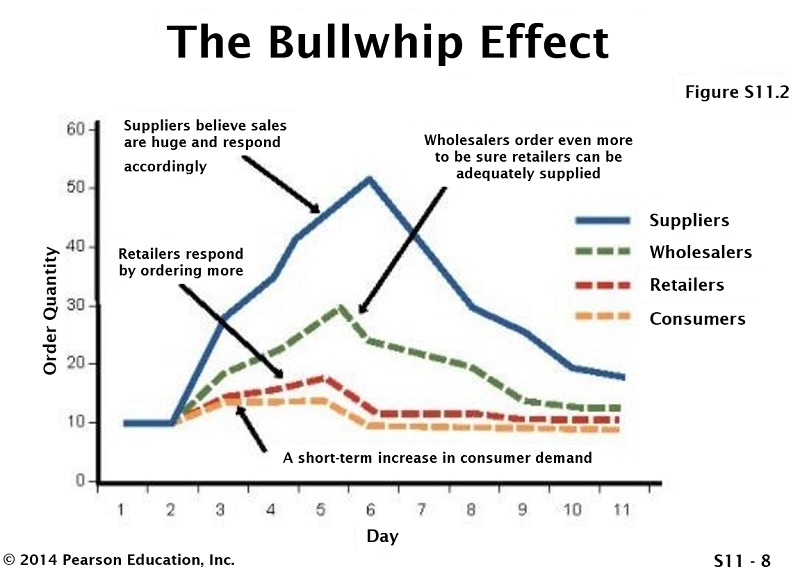
Schematically, we can see these factors through a graph:

Figure 3
Bullwhip Effect and FP&A
One of the negative effects of the bullwhip effect is the dissatisfaction of customers caused by delays and unavailability of a product in the market. Furthermore, by generating a mismatch between demand and supply, the bullwhip effect could be instrumental in lowering a firm’s efficiency, increasing costs and reducing profits.
The costs associated with the bullwhip effect are as follows:
- Overproduction and higher storage costs.
- The stock gets wasted if it becomes obsolete or may become obsolete as newer, upgraded products enter the market. Or, alternatively, a shortage of stock.
- Increasing prices or transportation mainly due to the Demand Fluctuation.
- The costs associated with the Return Policy.
- Labour costs due to higher workload for warehouse and logistics.
- Rents for new warehouses and costs for fluctuations in demand.
- Inventory costs.
How to Limit the Bullwhip Effect from the FP&A Position?
The FP&A team is right-positioned to prevent the negative impact of the bullwhip effect.
1. Communication is key
Clear and consistent communications can be ensured between companies up and down the supply chain. It allows you to limit excess quantities that are erroneously produced and distributed. FP&A can enter this process through quantity approval.
2. Forecasting Accuracy
Greater accuracy in demand forecasting allows for more targeted control over quantities. It must necessarily be repeated in order to quickly update the general scenario and take the appropriate countermeasures.
3. Centralising demand information
It can reduce the bullwhip effect. However, it will not eliminate it. The speed of adjustment is also important in case of an error generated by the forecasting system, especially with low-intensity orders and intermittent demand.
4. Create a contractual agreement with your customers/suppliers
5. Forewarned is forearmed
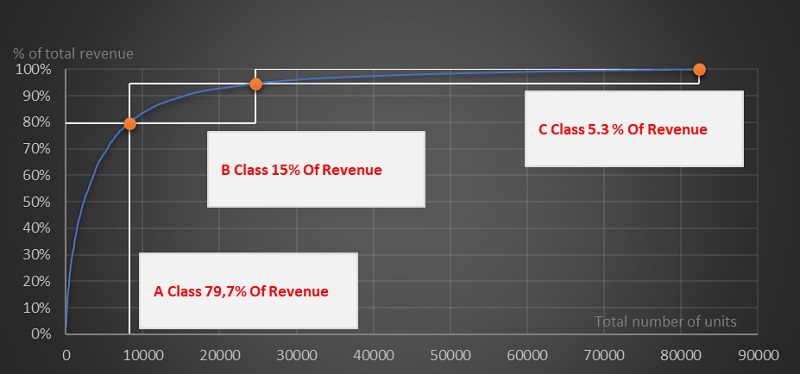
Create an in-depth check on the weekly or daily situation of the stock through the famous Pareto's law called 80/20. Approximately 20% of your products generate 80% of the turnover.
How to React and How to Plan?
In the context of any Supply Chain system, two basic extremes must be recognised.
- Companies that offer products with tight expiration dates (FMCG, Food, Fashion, Pharmaceuticals),
- Businesses that operate with durable products with no expiration date and companies with a perpetual stock of products that can be sold at any time (for instance, jewellery).
Within these well-defined extremes, we have a huge range and variety of companies with different characteristics. So, the first aspect of planning is really about what context we are working in. The second concerns the Inventory Turnover Ratio index and which metrics normally have low rotation.
A specific criterion for FMCG companies is the product’s expiration date. That means anything older than a certain date should be obsolete. To solve this problem, create a reserve following this disposal criterion.
However, in other cases, you will need to follow the Pareto rule and its ABC curve. Also, consider that you will have to create reserves during the budgeting phase for low-intensity products (B+C areas). Evaluate when you last sold that product belonging to those categories and think that all products with the same characteristics will have to be re-evaluated in your stock through either full or partial depreciation. Create a reserve in accordance with this rule and follow the stock evolution weekly. In order to understand the ABC Curve, please see the chart below.

Figure 4: The ABC Curve Visualisation
Conclusion
Many scholars of this phenomenon have tried to explain the bullwhip effect analytically and to correct it. The real problem is that the bullwhip effect cannot be eliminated but can be limited.
An accurate prediction system can be a good starting point to limit these undesirable effects. In addition, information sharing is essential. This can reduce the occurrence of forecast errors. However, the greater the demand volatility, the greater the bullwhip effect. The study of demand and forecast accuracy will play a central role.
The role of FP&A is specifically concerned with the presence and systematic monitoring of each step in the process. It can also create a financial buffer to curb this effect. The creation of reserves during the budget session is crucial to avoid future problems.
Subscribe to
FP&A Trends Digest

We will regularly update you on the latest trends and developments in FP&A. Take the opportunity to have articles written by finance thought leaders delivered directly to your inbox; watch compelling webinars; connect with like-minded professionals; and become a part of our global community.


