
The quality of a decision is a question about what data or lack of data the...

From Data to Real Insight as the Analytics Business Partner
December 3, 2020
 Many Finance professionals have an incorrect perception of the word “insight”, but here is a simple way to validate if you provide insight or “just” data. Ask yourself, what decision a business can make based on the data you have provided? Insight is something valuable and not yet known by the business, but when known, the business uses it to make decisions that are data-driven.
The figure below describes how insight sits between Hindsight Information and Predictive Foresight. Also, it demonstrates how advancing analytics moves Finance from providing information on ”What Happened” and ”Where It Happened” to storytelling about “Why It Happened” with real insight. In this article, we will explore how to generate real insight for data-driven decisions.
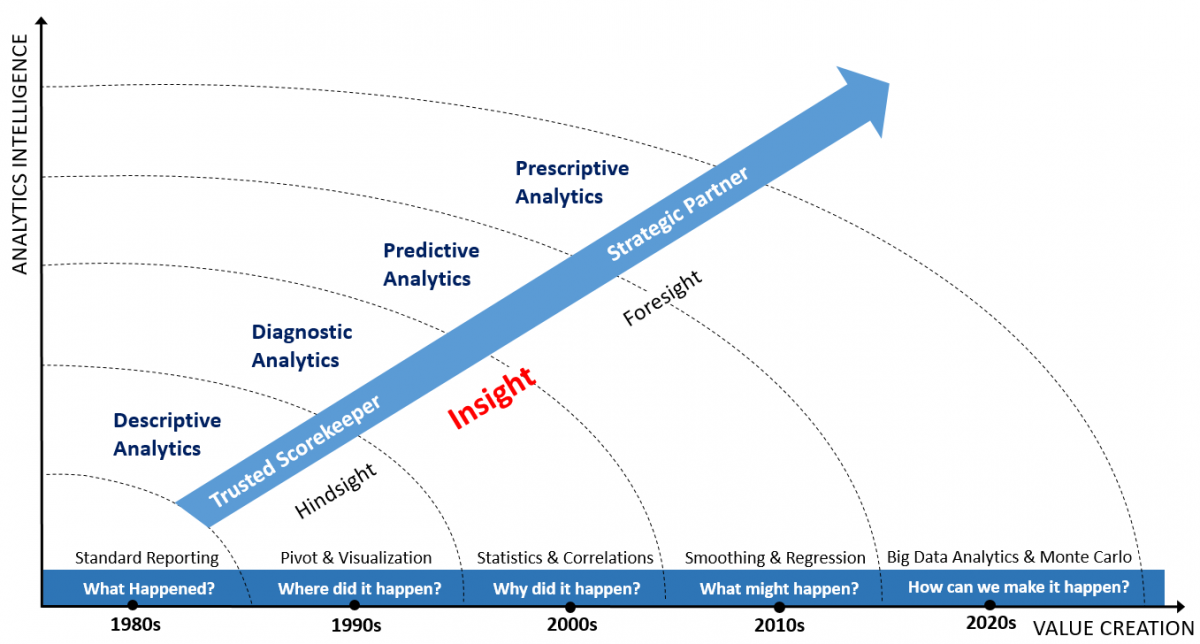
It starts with Standard Reporting
For example, Finance has noticed that global sales have dropped -1% in the past two quarters and is thereby able to tell “What Happened” as part of its high-level standard reporting.
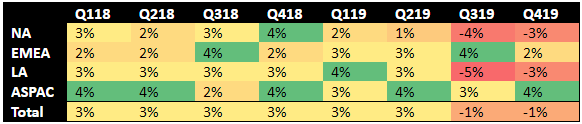
Also, Finance can drill down to find “Where It Happened”; i.e. global sales are down 1%, which mainly relates to the regions North America (NA) and Latin America (LA), which are down -3% to -5% year-over-year (YoY). In contrast, all other regions are up 2% to 4% YoY. Is this insight? No, because we haven’t yet told Why It Happened…
A classic mistake when trying to provide insight
To understand Why, 99% of all Finance groups will use their soft skillsets (communication, acumen, and teamwork) to get involved with the VP of Sales to understand his perspective on why sales are declining in NA and LA.
The VP of Sales explains that the last two quarters had several deals which slipped to the next quarter in LA and NA, and provides a list below of the slipped deals:
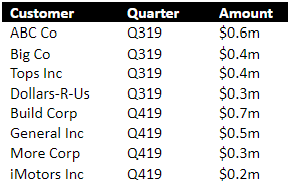
Is this then insight? No, it is information or knowledge at its best, but you cannot take any data-driven decisions from it, so we still don’t know if the underlying driver for Why sales are down is because of slipped deals. The VP of Sales is providing his “first-hand explanation”, but unfortunately, Finance most often takes it as-is and stops their investigation here!
Looking for patterns to uncover real insights
However, what could Finance have done to provide real insight and not simply to copy a message from the VP of Sales? The 1% of Finance professionals who act as an Analytics Business Partner™ (ABP) approach the above situation differently.
It starts with curiosity. Are slipped deals really the underlying issue? The ABP will employ analytics to look for patterns in data to uncover insights.
First, the ABP pull sales data by customer and salesman for the past two years and immediately observe there is no change in slipped deals YoY. As such, the VP sales explanation wasn’t sufficient, so the ABP will have to dig deeper for real insight.
The ABP often use multi-source data to gain multi-dimensional perspectives. A salesmen's tenure may be pulled to learn if tenure correlates with sales performance. Quick insights appear, such as, the longer the tenure of a salesman, the more the salesman sells. A very strong correlation between tenure and sales by salesmen is shown in the chart below.

The Analytics Business Partner can now tell something valuable not yet known by the business, which the business can use to make decisions which are data-driven. In this case, that tenure is the underlying driver for how much the business is selling.
Understanding the underlying driver
We can see that even though NA and LA have the same amount of salespeople, they have replaced salesman 5 (5 LA) and Salesman 10 (10 NA), who were some of the top sellers, with salesman 11 (11 NA) and Salesman 12 (12 LA). As tenure is the underlying driver for sales performance, this will have a significant effect on overall sales performance when there is a change in tenure.
Understanding this relationship, the VP of Sales now learned to reduce overall sales expectations for the coming quarters, or if he cannot “afford” such reduction, he knows that initiatives need to be taken as this trend will continue for a while until more tenure has been built in the sales force.
Conclusion
This is an example of how Finance use Diagnostic Analytics to tell ‘Why It Happened’ by finding a correlation for the financial performance and thereby providing real insight. And as demonstrated, insight is not to copy/paste of a message from having asked a Business Executive Why it happened. Insight is something that Finance has found through analytics that the business can form decisions from that are data-driven. This way of thinking in Finance is how the Analytics Business Partners differentiate themselves!
The full text is available for registered users. Please register to view the rest of the article.
Related articles

A recent Accenture study showed that 79% of large company executives think that companies that don’t...

The explosion in computing and data processing power has led to an exponential increase in data...

According to a recent survey by Prophix and FP&A trends, 88% of companies claim they have...

The decision cycle will help you and your association make knowledgeable decisions that drive exceptional results...

Any activity or business process executed in the various departments across the enterprise has an impact...
+
Subscribe to
FP&A Trends Digest
We will regularly update you on the latest trends and developments in FP&A. Take the opportunity to have articles written by finance thought leaders delivered directly to your inbox; watch compelling webinars; connect with like-minded professionals; and become a part of our global community.