
In Part 1 of this article, we explained the data challenges faced by FP&A as well...

Self-Service Analytics: FP&A Challenges
March 13, 2019
This is the first part of a two-part series on Self-Service Analytics.
Finance, FP&A & Data Challenges
Any activity or business process executed in the various departments across the enterprise has an impact on the financials.
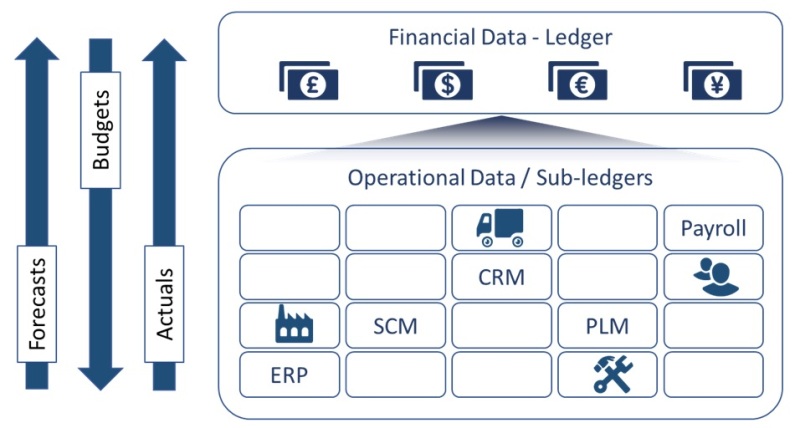
At a macro level, the interaction of the Finance organization with the rest of the enterprise can be bucketed into three categories:
- Financial Operations: Day-to-day as well as closing activities across the enterprise create financial transactions which manifest as journal entries in the ledger.
- Planning/Budgeting: Planning processes during which the Finance team gathers forecasts from the different departments and communicates their budgets back to them.
- Analysis: Analysis of all the data for setting up the budgets and pacing the finances to provide visibility on how the organization is performing till the closing of the books.
As the name suggests, the FP&A (Financial Planning & Analysis) organization within the Finance function focuses on Planning/Budgeting and Analysis.
Complex Data Landscape
The application landscape is very complex in medium to large organizations. Organizations have a Financial Management application which includes the General Ledger. Different departments implement different “sub-ledger” applications to execute their respective business processes. The Sales and Marketing team implements CRM application, HR implements HRM and Payroll, the logistics team implements Transportation Management and the Engineering team implements PLM applications. Many organizations implement ERP applications with the intention of integrating many different departments and business processes together.
To further complicate the matters, more often than not, there are multiple instances of these applications within an organization – multiple ERPs, multiple PLMs and multiple CRMs.

As these sub-ledgers are implemented and deployed, there are several challenges for the FP&A community downstream.
- Siloed inconsistent design prevents the ability to do analysis across business units e.g. one business unit might decide to implement Standard Costing and the other might decide to implement Average Costing.
- Missing Master Data Management impedes the ability to connect data across applications. e.g. for the same transaction, if the customer number and name is different in the CRM application versus the ERP application, then the FP&A team cannot link the two data sets together - Orders from CRM and Invoices from ERP - for analysis.
- Data cannot be merged or aggregated due to lack of Common Data Definitions.
E.g. Purchase Orders - if, among two user communities, one uses a particular field for Need-by Date and the other uses the same field for Promise Date, it becomes next to impossible to systemically merge and analyze the data.
The FP&A organization also has to support continuous changes to:
- Business strategy and direction which aredriven by customers, competitors, markets, supply chain and regulations.
- Organization structure which could be organic within the company or through mergers and acquisitions
All these exponentially increase the challenges faced by the FP&A organization.
For the FP&A team to be effective and to have a sustainable framework to deliver on their objectives, they have to work on two parallel paths:
1. Establish a Self-service analytics framework working with the CDO
The FP&A team should build a close partnership with the Chief Data Officer’s organization to ensure:
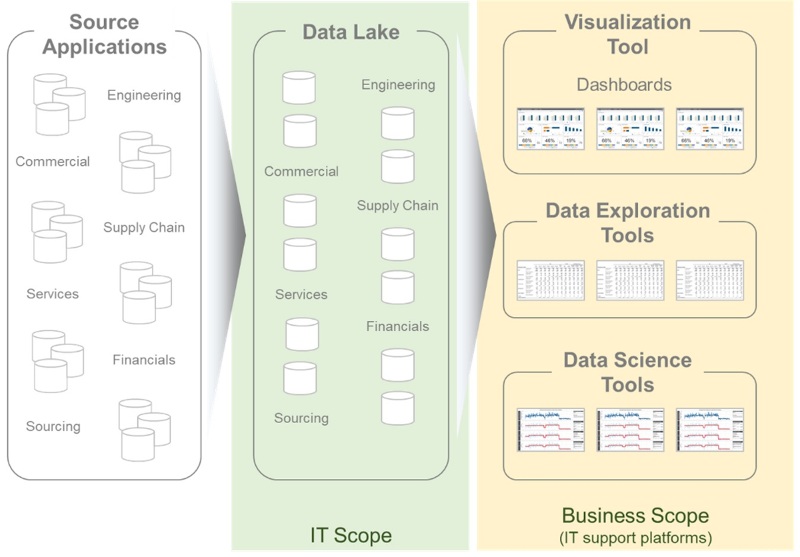
- Data Availability – Data across the enterprise is readily available, structured for analytics and there is a data catalog that documents available data.
- Data Platform – There is a robust platform which provides the data in a timely manner, performs efficiently and can scale to meet the demands of the organization.
- Data Tools – There are user friendly easy to use Data Analysis tools which the FP&A users can use to do the analysis themselves (Self-service).
Since there are a lot of data gaps across the organization, the FP&A team ends up doing a lot of data manipulation themselves. So, it is critical that the Data Tools support the ability for the FP&A team to merge the data from the applications along with the data they host locally in their laptop including ‘mapping’ & ‘cleanup’ rules. These are mostly stored in spreadsheets. So, the ability of the Data Management framework to integrate these spreadsheets in their data platform is a critical need for the FP&A team.
The rest of this article will focus on how we could enable the FP&A organization with Self-service Data Analysis.
2. Active role in “sub-ledger” business process & application implementations
The subledger applications like CRM, ERP, PLM, etc. are where the data created and modified. The FP&A community should be an active participant in deciding how this data is managed and should take an active role in the design and implementation of these operational applications.
Adopting Self-service Analytics
We often hear the term ‘self-service’ used in relation to analytics. Organization are driving more and more towards data-driven decisions – whether it is via simple dashboards which provide visibility to ‘what has happened or is happening’. Or with more complex data science or machine learning driven insights into ‘what could happen’. FP&A team members wish to do this themselves without depending on IT. Hence how the data is consumed is a critical factor in defining the Data strategy. Before we define our usual data management components like data modeling standards or the architecture of the underlying ecosystem, we need to understand how we are going to deliver the data.
Below is Gartner’s definition of Self-service Analytics:
Self-Service Analytics is a form of business intelligence in which line-of-business professionals are enabled and encouraged to perform queries and generate reports on their own, with nominal IT support. Self-service analytics is often characterized by simple-to-use BI tools with basic analytic capabilities and an underlying data model that has been simplified or scaled down for ease of understanding and straightforward data access.
The key words that pertain to self-service are highlighted above. As I had shared in my earlier post, the organization’s dynamics play a critical role in defining the data strategy. These organization dynamics determines the Data Literacy of the organization – not only for the business leadership and business user community, but for the IT organization as well. Data Literacy determines how the data is going to be delivered and consumed. We will discuss in detail in the next section about the data literacy of the FP&A team. We will quickly touch on the maturity of the business leadership and IT organization in adopting and making data-driven decisions.
Business Leadership: The leadership team should lead by example. Does the CFO and FP&A Manager execute their monthly/quarterly reviews directly off online dashboards or do they manage their meetings using powerpoint slides? Does the organization have a Chief Data Officer sitting at the leadership table or is Data & Analytics buried multiple levels deep in the organization hierarchy? If the leadership is data-savvy and makes data-driven decisions, then the FP&A team has no choice but to do the data-driven analysis to derive the insights.
IT Organization: The IT organizations should also evolve in their thought process. They should realize the fact that the FP&A team understand the data more than they do.
They should also adapt to a world where they don’t have to be a “reports factory” and they are allowing more autonomy to the FP&A team.
FP&A Transformation
Let us first understand how the FP&A community has transformed in the past couple of decades. Historically the development of reporting and business intelligence solutions followed the typical SDLC (software development life-cycle). FP&A team members defined the requirements and IT designed and built the solution. The FP&A team had to document not only what data objects and data attributes were required in the report or dashboard, but also define the user interface or how the report should look like or be formatted.
We are well aware of the challenges with this traditional approach:
- Reporting/business intelligence solutions took months to deliver.
- For dynamic organizations, their original requirements would change by the time the solution was actually delivered or the original requirements were no longer relevant.
- When the FP&A team members would see what was being delivered for the first time, new ideas would crop up in their minds. They would immediately provide new / updated requirements as feedback - going into a vicious cycle that would significantly delay the delivery of the reporting solution.
All this caused the user community to lose confidence in IT. They started transforming themselves into 'shadow-IT' organizations where they used desktop-based tools or installed reporting solutions on machines hidden below their office desks.
While this may not sound good from an IT standpoint, this situation resulted in a segment of the business user community becoming tech-savvy individuals. They managed their local databases and applications and built very sophisticated and complex reports and dashboards.
The other phenomenon that was happening is the behavioral change of the users. The millennials started to join the workforce in the beginning of the 21st century. This also coincided with the spread of the mobile phones which put technology in the hands of consumers.
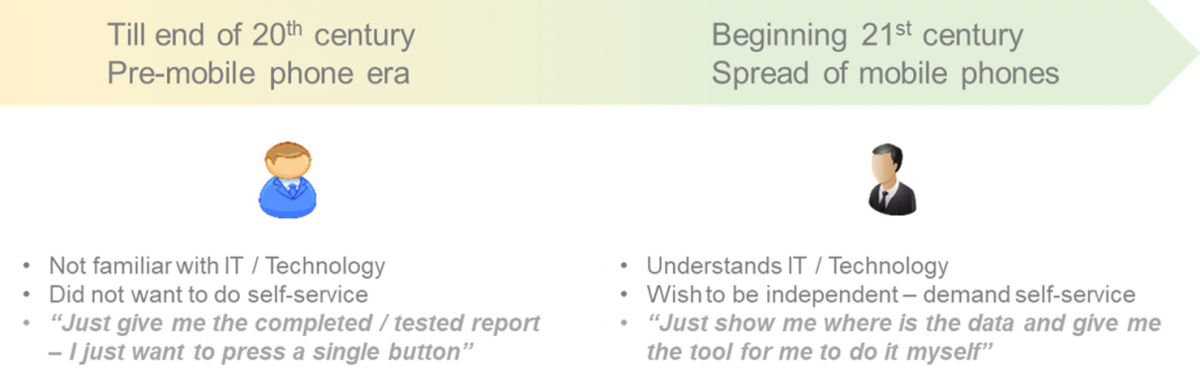
The earlier generation, with limited or no exposure to technology, did not want to do any self-service. They expected IT to deliver a fully designed, developed and tested report which they would execute on demand at the press of a single button.
By contrast, the millennials, who are more technology-aware, want to do reporting themselves. They just wanted an effective self-service tool and they want to know where the data is available. With these two things, they are off to the races building their own dashboards and reports.
Later we will try to understand how the self-service models differed across this generation gap.
In Part 2 of this article, we will define the boundaries and the framework for implementing self-service analytics.
Disclaimer: The opinions expressed in this article are the author's own and should not be attributed to the author's employer.
The full text is available for registered users. Please register to view the rest of the article.
Related articles

Advanced analytics is fast becoming a core enterprise competency. Organizations slow to develop it risk falling...

Are your KPIs, Scoreboards and other metrics safe from the Simpson's paradox?

The explosion in computing and data processing power has led to an exponential increase in data...
+
Subscribe to
FP&A Trends Digest
We will regularly update you on the latest trends and developments in FP&A. Take the opportunity to have articles written by finance thought leaders delivered directly to your inbox; watch compelling webinars; connect with like-minded professionals; and become a part of our global community.