Any activity or business process executed in the various departments across the enterprise has an impact...

This is the second part of a two-part series on Self-Service Analytics.
Self-Service Analytics Framework
In Part 1 of this article, we explained the data challenges faced by FP&A as well as how the expectations of the FP&A user community has evolved through the generations. In this article, we will explain how the boundaries have changed and the implementation framework.
What do we mean by Self-service in Analytics?
Before we get into the self-service models, let us first understand what is meant by self-service. Picture a scenario – a business user shows a dashboard to his/her manager. As they analyze the insights from the dashboard, the manager asks the business user to include another dimension in the dashboard and get back with the new insights by the next day. This is a new dimension that currently does not exist in the dashboard.
So, if the business user has to deliver the new insights, the following steps need to happen:
- Identify the data that is required to add the new dimension
- Find (or get) the data in the data repository
- Pull the data into the dashboard
- Modify the structure, business rules and visualization in the dashboard
- Publish the dashboard
Historically, either the user would have a ‘shadow-IT’ organization that would respond to the request or the user will get back to his/her manager that it will take months for IT to deliver the new insights.
On the other hand, if the business user could do all of the above steps by himself/herself, then the organization would be progressing towards becoming a self-service based analytics organization.
Self-service Boundaries
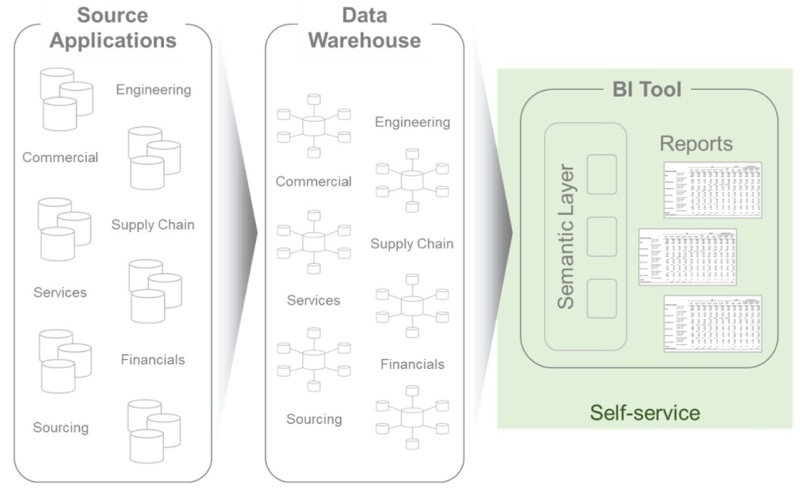
Traditional Self-service: The traditional business intelligence solutions primarily focused on delivering reports. It also had limited self-service capability by reusing the semantic layer in the business intelligence tool.

The users were limited to the pre-defined semantic layer which was normally built off a star-schema data model in a data warehouse / data mart. Any new data requirements to existing models would need an IT project with funding and would take quite some time to deliver.
Self-service was mostly limited to FP&A team members using drag-&-drop capability on data attributes and building cross-tab reports which they would usually export to excel.
The BI tool just became a source of data rather than a platform for analysis and insights. In reality, the analytics actually happened in excel and the results were visualized through powerpoint slides.
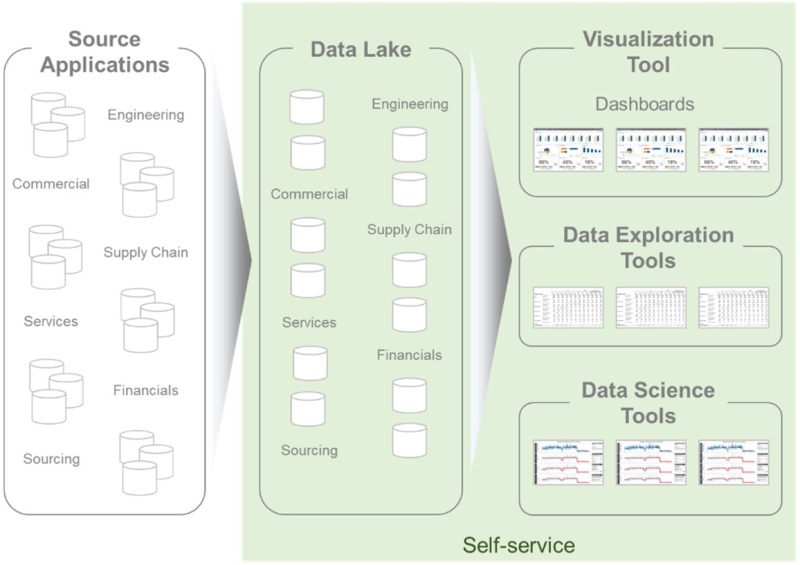
New Self-service: We discussed earlier the transformation that was happening in our business user community. To support the new demand of data consumption, the new self-service models have to expand on both dimensions:
- Tool: As we look at the various use cases from simple reporting to visualization to data science to machine learning, we realize that there is no single tool in the market that will do everything. So, our data delivery strategy should assume a portfolio of tools to support the various use cases.
- Data Availability: Similar to the tool discussion above, the data needs to be made available and accessible through various avenues based on the needs of the different personas consuming the data. Granularity and latency are also critical factors in deciding where to pull the data from across the landscape – whether it is in predefined semantic models or directly in the data repositories.

As we see above, the new model expands the boundaries of what would be included in a traditional self-service framework. It includes the various tools that could be used to support self-service analytics. It also opens up data repositories in the spirit of data democratization.
We will discuss next on what this means and how we should design and execute a self-service framework.
Self-service Maturity - Types of Self-service
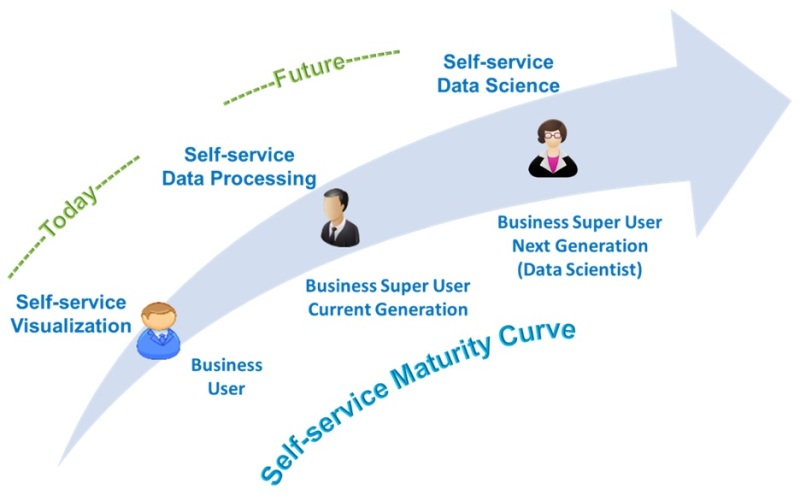
As we think about self-service analytics, it means different things to different audiences. And self-service will evolve and transform as tools available in the market become more mature and sophisticated.

Business User: For FP&A team members, self-service means building their own dashboards or reports. The users will normally use predefined data published by the IT organization. These are mostly “drag and drop” capabilities and the users are creating a ‘view’ of the data to support their business processes.
The initial self-service tools were dependent on the traditional data warehouse models mostly focused on building cross-tab reports. Over the past few years, this has evolved into visualizations. There are quite a few tools in the market that support this need. With in-memory capabilities, it is much faster to create basic insights with vast amounts of data using better graphics.
Business Super User Current Generation: The current generation of business super users take on the responsibility of quickly creating value-added artifacts for their teams. This is where rapid prototyping is necessary to quickly answer the questions posed by the leadership. The business super users should be able to quickly bring together data from multiple sources, link or merge the data, build aggregate data sets and publish it for wider consumption.
Historically this was done in ‘shadow IT’ organizations with desktop-based tools. A suite of new tools that have come into the market to support this rapid prototyping need at an enterprise scale.
Business Super User Future Generation: Looking to the horizon, we see the next generation of business super users who would have moved up the value(skill-set) chain. Colleges are including data science tools in their curriculum for almost all streams of education. So, when these students join the workforce in the near future, they will understand and will be more familiar with data science methodology and tools. They will be much better equipped to exploit the capabilities of data science and machine learning models. We will have to prepare ourselves to a scenario where business super users will demand platforms that will allow them to do the data science themselves.
Implementing Self-service – Self-service Toolkit
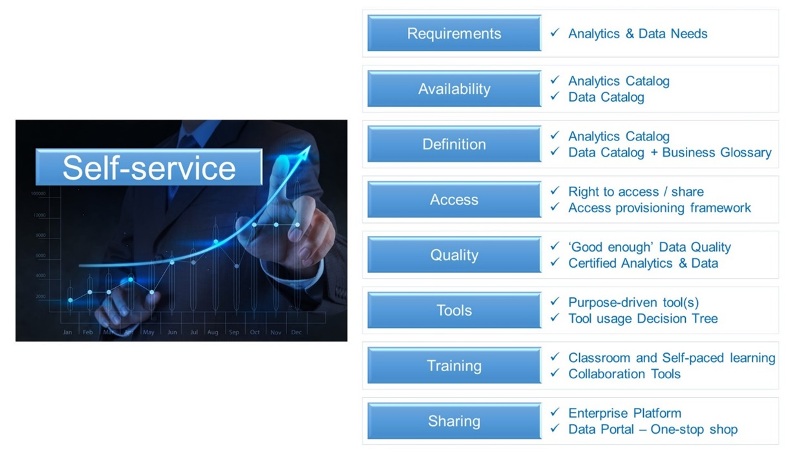
When FP&A team members wish to build analytics themselves, they are looking at a framework that addresses the below needs. For the time-being, we will focus this section on Self-service Visualization. We will cover the other two types as part of a future version.

- Data Requirements:
What data is required for deriving the insights?
Strategically, the CDO organization should define the data coverage strategy to meet the analytics requirements of the business. As shared here, the data could be Asset, Sensor, Fulfillment and Environmental. And the data could be sourced Internally or Externally. This approach gives a complete and comprehensive coverage of the data across the whole organization.
Tactically, for specific business needs, the FP&A team members should be able to articulate the detailed requirements for both:
- Analytics / dashboard / report
- Underlying Data requirements
- Data Availability:
Is the analytics available?
Is the data available? If not, how can we make it available quickly?
Once the users determine the required analytics, they should be able to browse the Analytics Catalog to check if the same or similar dashboard is already built. This allows reuse and avoids wastage of time and efforts.
If the dashboard is not available, the users have to check if the underlying data is available so that they can build the dashboard themselves. This information should be made available in a Data Catalog that lists all the data available for consumption.
Both these artifacts should be communicated widely, be readily accessible and easy to search & browse. These should be documented without any “IT jargon” so it is easily understood by the FP&A team members.
- Data Definition:
How do I know what the data means and how to use it?
Once the users find that data, they should be able to understand all the details about the data - what are the attributes in the data object, what are the allowed values in the attributes, how the data is structured in relation to other data objects, how the data should be used, etc. This is documented in the Business Glossary which is part of the Data Catalog.
- Data Access:
Do I have permission to use the data?
Can I share the outcome of the analysis and if yes, with who?
How do I get to the data?
As defined by the security and compliance framework of the organization, proper access provisioning should be implemented. It should also clearly communicate how the data can be shared based on the sensitivity classification.
Access provisioning preferably be a systemic process with workflows that will facilitate:
- Getting approvals from managers and data owners.
- Verification that the FP&A team members have completed pre-requisite trainings.
- Acknowledgment of compliance guidelines.
This process should also provide instructions on how to access the data along with links to training documents.
- Data Quality:
Is the data good enough for meeting my objectives?
For the FP&A team members to use the data in their decision-making process, they should have confidence in the quality of the data. Data Quality at a high level is composed of two components – Completeness and Accuracy. Simply put, the completeness measure indicates whether the data is there and the accuracy measure indicates whether it is the right data.
It may make sense for organizations to define Certified Data – a single source of truth for the enterprise. This could be extended to Certified Analytics for the dashboards.
Since this topic is very involved and merits a longer discussion, we will get into the details in a subsequent post.
- Self-service Tools:
Which tool do I use for my analysis?
Whether it is for building cross-tab reports, visualization with graphics or just getting data dumps, there are various tools in the market that will help with these different use cases. Working with the business user community, the organization may wish to select and implement one or a couple of tools to meet the overall needs of the business.
If there are multiple tools, there should also be a decision tree to help the users select the best tool for their predominant use cases.
- Training:
How do I to use the tool?
For self-service to be successful, having a well-thought our training program is critical. By its very nature, users who embrace self-service have the affinity to roll up their sleeves and jump into building dashboards. Also, the users could be spread globally in different locations. For this audience, self-paced training works best. The training should be structured and broken down into small modules which the users can easily review and learn.
At the same time, there are locations where there might be a critical mass which would justify the additional cost of classroom training. This is especially true for advanced users who wish to learn complex features of the tools.
Another approach might be Train-the-trainer. The organization could identify a few subject matter experts who show enthusiasm and are willing to provide the support locally. Special training sessions could be held for this group of business super users.
Finally having a collaboration platform to share best practices, news and the ability for the FP&A team members to ask questions makes the transition much easier. There could be analytics specific channels or community forums where everybody from a novice to an expert could collaborate.
- Data Publishing:
How do I share my analysis with a broader community?
Users building the dashboards in a self-service mode sometimes do it for individual or personal consumption. But more frequently these dashboards are built for a broader team. If so, how can the user share the dashboard with the broader group?
This could be done by implementing an enterprise analytics platform where these dashboards are published with the necessary access to provisioning controls in place.
It may make sense to implement a common Data Portal for the whole organization. This is a one-stop-shop for everything related to data and analytics in the organization. This portal should have links to the tools, platforms, training, standards, best practices, how-tos, instructions, help-desk, people to contact, etc.
This, hopefully, conveys the building blocks required to implement an effective self-service framework. As the market and business user mature in the use of analytics, we will soon come back to enhance this article and include all the additional nuances that come with either self-service processing or self-service data science.
Disclaimer: The opinions expressed in this article are the author's own and should not be attributed to the author's employer.
Subscribe to
FP&A Trends Digest

We will regularly update you on the latest trends and developments in FP&A. Take the opportunity to have articles written by finance thought leaders delivered directly to your inbox; watch compelling webinars; connect with like-minded professionals; and become a part of our global community.


