
After spending 15 years in the corporate life holding various finance leadership roles within diversified range...

Why Your Strategy is Flat
April 29, 2021
 What Does Your Strategy Look Like?
Suppose you were asked to distil down your entire business strategy into a single graph or visualisation; how would you choose to show it? Would you be able to convey the critical strategic decisions that your business needs to consider in order to maximise shareholder value? Would you be able to use that single visualisation to speak to both your Board and Executive team?
Would it speak to the strength of your market? Would it highlight your organisation’s competitive advantages? Would it identify why you need to make critical investments? How much do you need to invest? Or would it tell you when to evolve your strategy or exit the market completely?
Does this sound like an impossible task?
When it comes to most organisations, I think the answer all-to-often a resounding YES. That’s because most strategies are either too disjoined or worse…their strategy is actually flat.
What is a Flat Strategy?
In essence, Strategy is all about justifying growth over time.
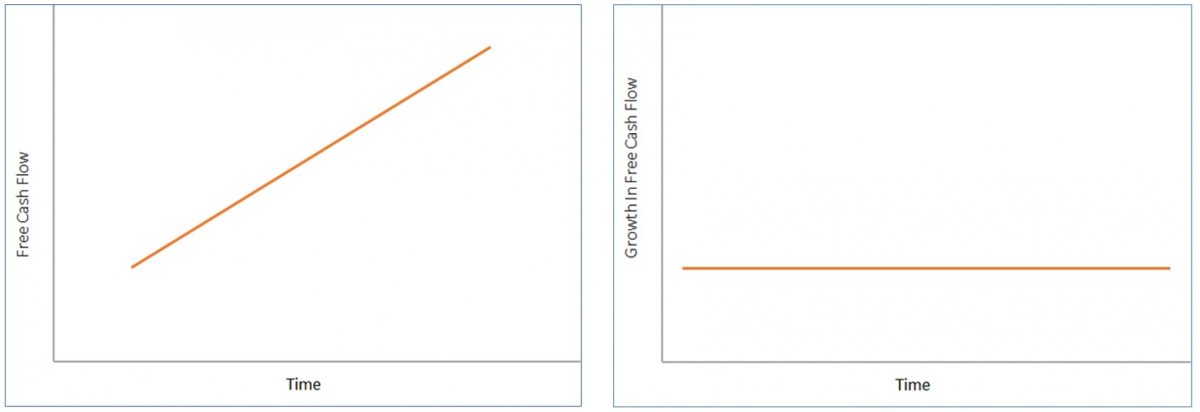
A flat strategy is a strategy that is based in large part on a single/constant growth rate. Although it is often represented as a sloping linear line, if you plot growth (not value) on the vertical axis, a constant growth rate represents a flat horizontal line.
A flat strategy is often the result of a company's lack of strategic awareness. This is true for multiple reasons. Short-term-focused organisations, companies that rely heavily on multiple comps, and companies that treat their 5-year plan or LRP as a strategy creation exercise all tend to fall into the flat strategy trap.
This is because these techniques don’t take into account the entire life cycle of the strategy.
What Does Strategy Really Looks Like for Most Organisations?
The truth is, it doesn’t matter if you are planning a strategy for a single product, a strategic business unit or an entire organisation, the same rules apply. You need to evaluate the life-cycle of the entire strategy. In the marketing world, this term is often called a product life-cycle curve. However, in Finance, we commonly call it a J-Curve.
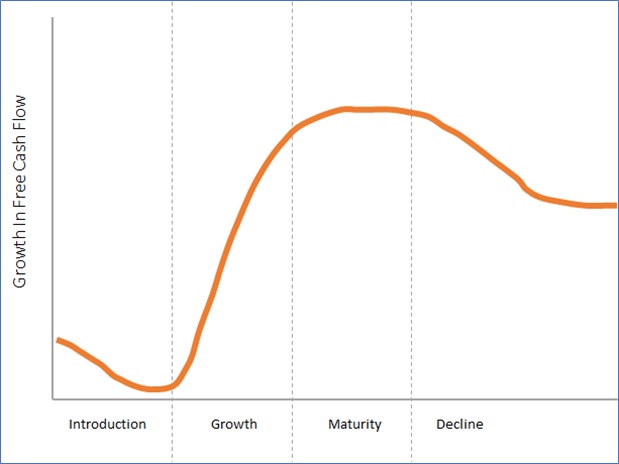
It generally starts with an introduction or investment stage. This stage is often dedicated to breaking down current market barriers and setting the stage for future competitive advantages. Almost all introduction stages start with a negative growth because it often involves investing in constraints or bottlenecks in order to disrupt the current status quo.
Once organisations start to gain market traction, they enter the Growth stage. This stage is often where the focus is on gaining market share while simultaneously trying to figure out the potential market size.
The Maturity stage is where organisations can more easily forecast future outcomes. Significant growth becomes more challenging to find and can often result in paying dividends or engaging in share buy-backs to drive share price growth.
Finally, Decline stage is when organisations start to succumb to competition or innovation. Incremental investments tend to make little sense and strategic decision all but dries up. Businesses in this category are largely run on NOPAT (Net Operating Profit After Tax). There are very few incremental changes in the Balance Sheet at this stage.
Evaluate Strategy in Phases Not Discrete Time Period
One of the key principles of the J-Curve is recognising that we’re referring to time phases, not static time periods. This is a significant departure from most forms of financial analysis.
Generally, Finance is fixated on static time periods such as a one-year budget, an 18-month rolling forecast, or a 5-year plan.
With the J-Curve approach, the focus shifts to recognising where your strategy lies in the cycle, how long it will remain at that stage, and any future remaining stages.
This approach feels much more liberating, and it pushes aside short-term constraints that often keep organisations from focusing on the big picture.
Is the J-Curve Right for My Organisation?
The J-Curve is the backdrop for your strategic story, and it should be told no matter the size of your organisation.
For Startups, the story is often about getting to the Minimum Viable Product (MVP). This usually involves founders explaining how their limited funding and immense sweat equity have gotten them to a point where user traction is just about to take off, propelling them into a long-lived growth stage.
For Growth companies, the story is often about speed and market potential. How fast can they gain market share and how big the market opportunity will be.
For larger enterprises, the story is often a little bit more challenging because the organisation is often not a single J-Curve but rather several different J-Curves, all at different stages of maturity. The key for large enterprises is to manage these different j-Curves like a portfolio. When to continue to milk cash cows, when to invest in more growth-stage businesses and when to divest or evolve strategies should be the key strategic decisions to focus on.
As obvious as the j-Curve sounds, this activity is often overlooked as it is crowded out by other short-term focused activities that rely on discrete time periods.
Strategy is a Bet
The J-Curve approach makes a lot of sense when driving strategy, but a common criticism is that J-Curves are difficult to predict with accuracy and are often highly subjective.
Yet, this is exactly why the J-Curve is the most important strategic tool available to senior management. That’s because Strategy is a bet. You put your chips on the table, and you hope your research, intuition and business expertise are correct.
But you should never rely solely on your own assumptions. You need to work with other subject matter experts to build the best strategy. This requires discussion and debate around different opinions. Influencing others and forming peer consensus is a critical strategic process.
Furthermore, it also forces leadership to constantly examine their current assessment of the business (avoiding anchor bias).
A company that believes it is in the growth stage and will likely be there for another five years should routinely assess whether that statement is true. This is the best way to take a holistic approach to Strategy.
The article was first published in Unit4 Prevero Blog
The full text is available for registered users. Please register to view the rest of the article.
Related articles

In finance, we’re constantly chasing various financial metrics. But focusing on a narrow set of metrics often...

The Plan, Prioritize and Execute (PPE) model is an effective tool for an integrated strategic and financial...

On November 18, 2020, the International FP&A Board welcomed two FP&A thought leaders - Mike Huthwaite...

Strategic planning is mostly done with qualitative analysis. In this article, we will explore the use...

Lately, I’ve noticed a significant uptick in the number of connections I have on LinkedIn who...
+
Subscribe to
FP&A Trends Digest
We will regularly update you on the latest trends and developments in FP&A. Take the opportunity to have articles written by finance thought leaders delivered directly to your inbox; watch compelling webinars; connect with like-minded professionals; and become a part of our global community.