
The future of IBP will be to plan across the whole value chain. A final step...

Integrated FP&A: How to Close Complexity Gaps
May 2, 2018
 It is said that a picture is worth a thousand words. In the case of the one on the right, it is especially true of how Financial Planning and Analysis (FP&A) executives can drive significant value for global organizations. How? By enabling them to avoid unintended consequences of decisions that erode value. In other words, by enabling them to effectively manage complexity.
Research consistently shows that managing complexity is a key concern of global CEOs. And for good reason! The cost of complexity can be significant – upwards of 5% of sales. Moreover, it’s a pervasive problem that erodes value in different ways, as illustrated below in exhibit 1.
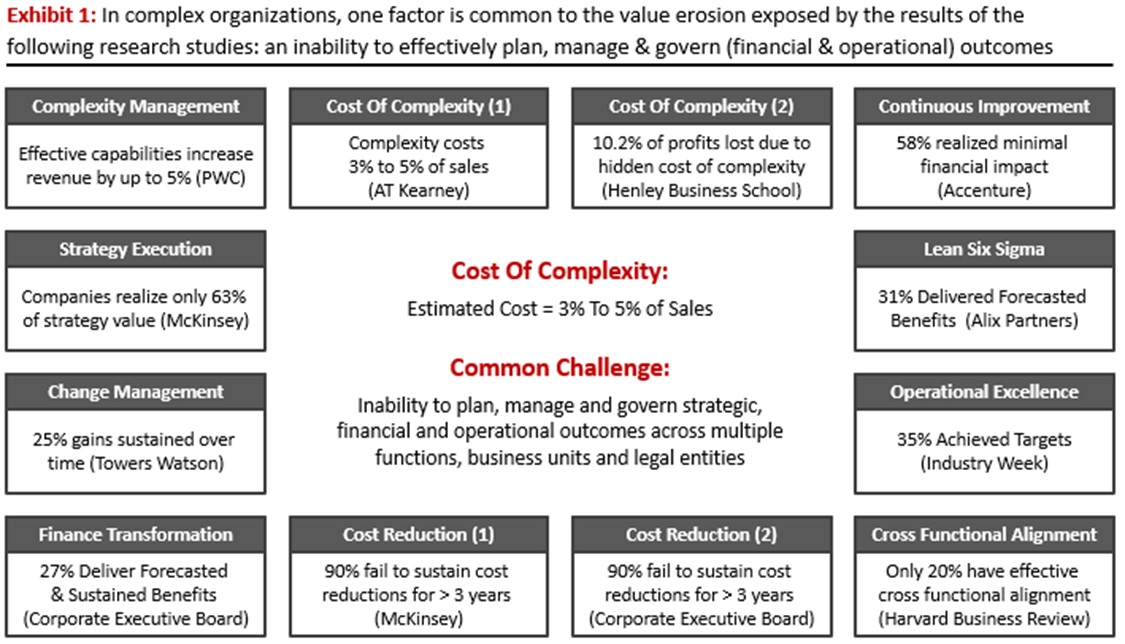
These different forms of value erosion all stem from one common challenge. That being, an inability to plan and manage outcomes – especially the relationship between financial and operational ones. Helping organizations manage this relationship, and thereby avoid unintended consequences that cause value erosion, is the central point to the value of strategic FP&A functions. It’s also the core idea of this article.
Why Can’t Organizations Manage Complexity?
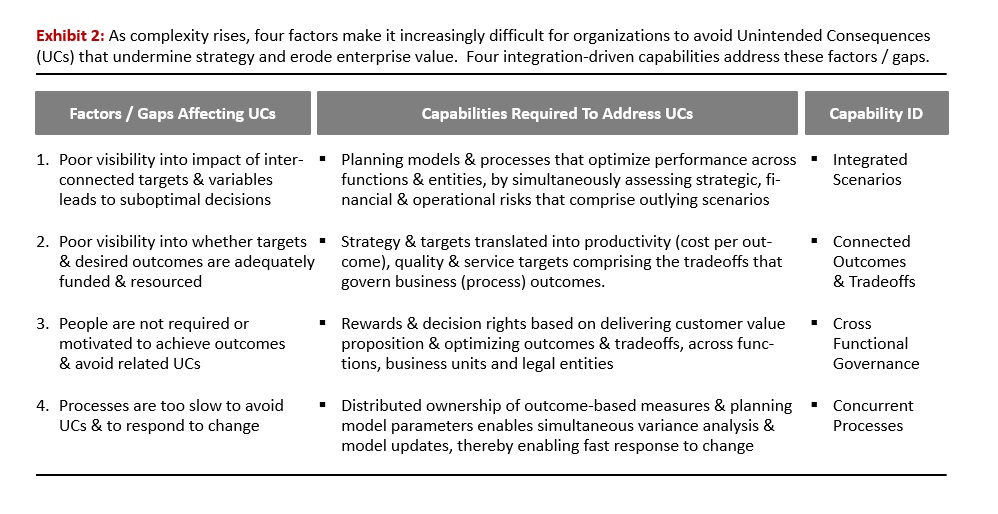
As complexity increases, financial and operational outcomes become highly interconnected. Organizations have difficulty achieving financial objectives (eg. margins and costs) while also achieving strategic (eg. growth, customer service) and operational (eg. quality and service levels) ones. Complexity blurs the “line of sight” between conflicting objectives. When this happens, unintended consequences become more common. Four factors account for the vast majority of unintended consequences. These factors, along with the capabilities required to address them, are illustrated below in exhibit 2.
One major obstacle impairs the ability to manage outcomes in complex organizations. That being, the processes, models and structures that they to plan, manage and govern their business. More specifically: immature and outdated ones that obscure risk, reinforce functional silos, sub-optimize resource allocation and impede change. The underlying problem: inadequate planning and performance management (P&PM) integration!
What Comprises Fully Integrated Processes?
Integrating strategic, financial and operational P&PM processes is not a new idea. In the manufacturing sector, Integrated Business Planning (IBP) has long been advocated by Sales and Operations Planning (S&OP) pundits and software vendors. Other integration terms include Integrated Performance Management, Integrated Financial Planning and Integrated FP&A. What often results from these different terminologies is confusion. Why? Because there is no universal definition of what fully integrated P&PM processes mean.
This confusion has led to one reality for many global organizations. Efforts to improve P&PM processes through integration have stalled. They’ve been unable to make meaningful improvements to resource quantification and strategy and profit alignment – two objectives that define the degree of P&PM process integration and maturity. These terms are defined below and form the basis for the maturity model illustrated in exhibit 3:
- Resource Quantification: Quickly and accurately quantify financial and operational resources that support desired revenue, profit, cost, service and quality targets, across multiple functions and entities. Component capabilities (defined in exhibit 2) include integrated scenarios and connected outcomes and tradeoffs.
- Profit & Strategy Alignment: Quickly reset targets and rewards, while reallocating resources across functions and entities to fund objectives and optimize operating results and project portfolio ROI. Component capabilities (defined in exhibit 2) include cross-functional governance and concurrent processes.

Despite implementing P&PM technologies and approaches (eg. rolling forecasts, driver-based planning, zero-based budgeting, activity-based costing/planning, risk-adjusted planning, balanced scorecard), processes are still fragmented, which is represented by the “X” on the chart. As a result, complexity-driven gaps remain. This is depicted by the difference between points X and Y on the chart, with the latter representing fully integrated processes.
When P&PM reaches a fully integrated state, there are no differences between strategic, financial and operational processes. In manufacturing, for example, supply chain planning and cash flow forecasting are supported by one model. Rolling forecasts and sales & operations planning become part of a single process that features integrated scenarios. Such processes allow organizations to simultaneously answer the questions in exhibit 3. Even in the most complex of circumstances where multiple changes (eg. pricing, sourcing, volume, mix, M&A, new products, customers & channels) are happening at the same time.
What results from fully integrated processes is a “single version of the truth”. Like “fully integrated”, this term has been liberally and inconsistently used to describe different forms of maturity. A more complete, yet simple definition, is when organizations can simultaneously and collectively answer the questions in exhibit 3.
Analytics & Process Maturity
Analytics is a key driver of such mature P&PM processes. While Predictive Analytics and Machine Learning contribute to such maturity, the real driver is Prescriptive Analytics – tools that quantify the best outcome among different choices, using mathematical modelling techniques. What’s different about them are the questions they answer:
- Predictive Analytics: How can we sell more?
- Prescriptive Analytics: Do we have capacity? Will it increase profits?
Another way of describing Prescriptive Analytics, from a P&PM perspective, is this: tools that enable mature forms of driver-based planning. What’s different about these driver models is that they provide a realistic representation of a business, from both financial and operational perspectives. Examples of capabilities comprising these models are provided below:
- Dynamic Drivers: Models that translate the impact of upstream driver changes on downstream activities by simulating the flow of goods, services and resources across value chains. For example, translating changes to sales volume and mix into requirements for inventory, warehouse and transportation resources, warranty claims, cash flow and foreign currency exposure. A key feature of this modeling approach is that it separates independent drivers from those that are dependent, thereby minimizing the number that needs to be forecasted.
- Driver Rules: Rules that define how financial and operational resources behave when certain events occur. For example, when capacity thresholds are met, these rules can define how headcount, employee productivity and (variable and fixed) employee costs behave upon adding a new shift.
- Optimization: Mathematical algorithms quantify the best outcome for a specific target (eg. profit, cash flow, sales) given different constraints and assumptions about things like volume, pricing, selling price, mix, and service levels.
Prescriptive Analytics is not new. Software tools have been available for years. During this time, they’ve created $ Billions in insight-driven value. However, Prescriptive Analytics vendors have not addressed one critical challenge: helping organizations sustain this value by effectively integrating these tools into financial and operational processes.
Strategic FP&A Value Proposition
What’s new are technologies that address this integration challenge. The incremental capabilities (exhibit 2) they provide address complexity gaps (exhibit 3) that cost global organizations up to 5% of sales (exhibit 1). What results are fully integrated P&PM processes that enable step change improvements how organizations to plan, manage and govern their business.
These fully integrated processes enable similar improvements in the ability of FP&A to play more strategic roles. In so doing, they provide a catalyst for transforming Finance and FP&A into functions that drive business value. Conversely, the absence of key capabilities (that enable these processes) does much to explain why:
- Only 27% sustain benefits from finance transformation efforts, Corporate Executive Board
- Only 40% of global finance executives rated their FP&A capabilities as effective, APQC
Successfully exploiting these innovations, while avoiding the missteps from others, requires a clear understanding of where the value of integrated processes comes from. That being from eliminating functional silos that prevent organizations from maximizing the value of business outcomes. In other words, from effective cost structure management.
Unfortunately, the vast majority of Finance-driven initiatives fail to achieve this objective. Despite all their investments, global organizations still use planning and performance management processes that are only marginally more mature than they were 100 years ago. The evidence lies in the unwritten rules that continue to shape organization culture.
Culture & Unwritten Rules
Ultimately, the value derived from fully integrated P&PM processes depends on management’s ability to quickly reallocate resources in response to changing market conditions. Fully realizing this value often requires changing cultural norms that govern how people behave and make decisions. When transformation programs falter, it’s often because organizations have been unable to effect these changes.
Resistance to such change can be explained by unwritten rules – behaviors that employees believe are necessary for personal success. Examples of unwritten rules include the following:
- Always under promise and over deliver
- Never submit your real budget the first time
- Inflate your budget because it will likely be cut
- Avoid specific measures, especially if you don’t control them
- Always achieve your budget, because it’s what’s really important
- Get the most people reporting to you as a real sign of power
- Protect your budget, because you won’t get it back
Unwritten rules result from deficiencies in the way organizations plan, manage, and govern their business. Strong leadership and human performance systems can partially address these deficiencies. However, as complexity increases, the effectiveness of these efforts diminishes. It eventually becomes too difficult to overcome one commonly-held belief that underlies many of these rules – that target setting and resource allocation is broken and unfair.
Unwritten rules and behaviors don’t go away on their own. Regardless of systems and policies, people will not do things that [they believe] will adversely affect them. Unwritten rules can promote behaviors that undermine the best designed planning and resource-allocation processes. They make it unlikely to get people to:
- Collapse budgeting cycles, when doing so impedes their ability to negotiate for resources
- Forecast real resource requirements, when they believe that they must attain their budget
- Make resources available to others, when they believe they won’t get them back when needed
- Focus on enterprise performance, when functional budget attainment trumps all other objectives
Such cultural issues are often viewed as the domain of Human Resources. However, the absence of key capabilities (shown in exhibit 2) does more to explain the presence of unwritten rules than most other factors. In this context, simultaneously driving both process and behavior change is an important element of effective Finance and FP&A transformation.
Getting Started
To FP&A executives, the value of analytics seems intuitively obvious. While this might be so, experience shows that the value actually realized (from their use) does not always live up to expectations. As a result, getting funding for analytics and other finance programs aren’t getting any easier.
One way to address this situation is by focusing on a challenge that FP&A is well positioned to address: that being effective complexity management. By doing so, FP&A is more likely to get the resources it needs to support strategic aspirations. Especially with a value proposition worth up to 5% of sales.
Getting such an initiative off the ground can seem daunting. Especially when FP&A leaders are consumed by (day to day) tactical activities. But it doesn’t need to be a major undertaking. The first step can be done in a matter of days. It entails developing a shared understanding among key stakeholders about answers to the following questions:
- What do fully integrated P&PM processes look like?
- How do prescriptive analytics enable such processes?
- What incremental capabilities result from process integration?
- How will stakeholders benefit from these capabilities & processes?
- What challenges will the processes address & what’s the value?
Armed with answers to them, FP&A leaders can quickly assess the potential value and benefits of more mature and analytics-driven P&PM processes. In so doing, they can also make a compelling business case for resources to launch a Finance / FP&A transformation program.
Summary
The cost of complexity can be significant – upwards of 5% of sales in global organizations. Forward-thinking FP&A leaders can play a significant role in realizing this value by leveraging technology innovations that support fully integrated P&PM processes. In this context, analytics can provide a catalyst for transforming FP&A into a more strategic partner that drives tangible business value.
The full text is available for registered users. Please register to view the rest of the article.
Related articles

In this article, Niels van Hove argues that while effective integrated FP&A can thrive in the...

Many experts agree that IBP has a monthly check and balance with the budget and the...

Integrated Financial Planning (IFP) and Integrated Business Planning (IBP) mean different things to different people. Primarily because...

Mature driver-based planning models are an essential component of effective rolling forecast processes in complex, global...

Managing enterprise productivity is an essential capability for value-focused Finance executives. It provides the basis for...
+
Subscribe to
FP&A Trends Digest
We will regularly update you on the latest trends and developments in FP&A. Take the opportunity to have articles written by finance thought leaders delivered directly to your inbox; watch compelling webinars; connect with like-minded professionals; and become a part of our global community.