
The corporate planning process is a controversial subject on which opinions differ widely. But experience has...

Productivity Management: An Essential Capability For Finance Executives Seeking To Drive Strategy & Business Value
November 26, 2018
 Managing enterprise productivity is an essential capability for value-focused Finance executives. It provides the basis for superior strategy execution, cost and profitability management, by purging organizations of one of the primary causes of value erosion: functional silos.
The world is filled with articles about the need for Finance functions to be better value drivers. Ones that shape the definition and execution of strategy, while simultaneously maintaining competitive cost structures that support profitable growth.
These aspirations underlie a bevy of buzzwords such as Finance Transformation, Finance Business Partnering and Strategic Finance. Whatever label is applied to these aspirations, finance executives frequently fall short of achieving them. Especially in global organizations that exhibit the complexity characteristics shown below in Exhibit 1.
Exhibit 1: Complexity Characteristics – As the number of complexity characteristics increase, Finance Functions (and organizations as a whole) are more likely to be affected by complexity-related challenges and functional silos
- Large Scale: Many products, brands, services, customers, employees, vendors, purchased parts & commodities
- Variability: In demand volume, product & customer mix, inventory & service levels, product pricing & input costs
- Rapid Change: To products, suppliers, services, processes, projects, operational constraints, organization structures
- Organization Structure: Multiple legal entities, Business Units (BUs) , Shared Services and geographies
- Interdependence: BUs share customers, suppliers, production and back office services, thereby obscuring profit drivers
- Globalization: Strategies deployed through supply chains that cut across multiple entities
Why is it difficult for finance executives to realize these aspirations? One reason is the persistence of functional silos. Not only do they undermine strategy and impede change, they erode value by causing dissatisfied customers, lost revenue and bloated cost structures.
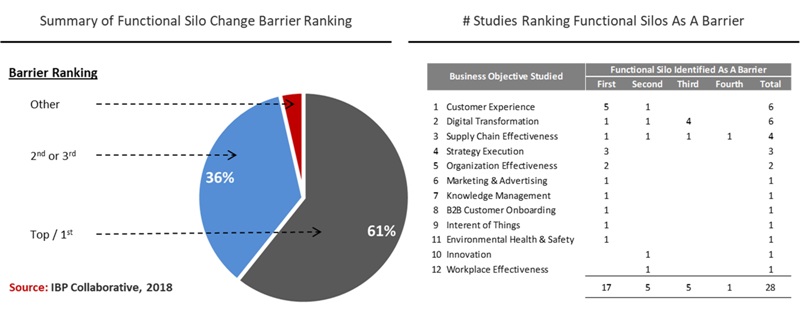
As shown in Exhibit 2, functional silos – not data silos - are one of the top barriers to achieving common business objectives, according to a host of recent research studies.
Exhibit 2: Out of 28 research studies, 27 (or 97%) ranked functional silos as one of the top 3 barriers to achieving key business objectives. Of these 17 (or 61%) identified silos as the top barrier, while 36% ranked it as the 2nd or 3rd greatest barrier
Alignment Paradox
These are classic examples of “horizontally-based” business objectives and initiatives. Others include operational excellence, quality management and six sigma. What’s common to them is that their underlying value is based on improving cross-functional outcomes, horizontally across functions and entities.
The problem is that organizations don’t plan, manage and govern this way. Rewards and decision rights typically follow functionally based budgeting and reporting processes. As a result, these “vertically-based” financial processes can be at odds with “horizontally-based” strategies. In other words, financial processes are not always aligned with corporate strategies. This is the “alignment paradox” facing Finance executives in global organizations.
Enterprise Productivity Management
One way of addressing this alignment paradox is with enterprise productivity management – a method for managing how effectively organizations produce key business outcomes, examples of which are provided below:
- New & retained customers that are ready to buy from us
- Completed orders that meet customer expectations
- Positions that are staffed with motivated and capable people
- Suppliers that are capable of providing quality products when needed
- Available products that meet customer quality and service level expectations
These examples also illustrate what productivity management is not. That being a method for managing the efficiency of individual functions, activities and tasks. It entails a broader perspective that focus on key factors that drive business value. It has four key benefits, which are illustrated in Exhibit 3, described in detail below and summarized as follows:
- Improve transparency by way of a productivity management framework
- Drive continuous improvement and cost reduction, with readily available and accurate process cost data
- Break down functional silos by managing key tradeoffs that govern enterprise performance
- Align employees around value optimization a establishing shared rewards based on managing key tradeoffs
Exhibit 3: Productivity Management Capabilities – Three productivity management capabilities play a central role in helping organizations to more effectively manage functional silos.
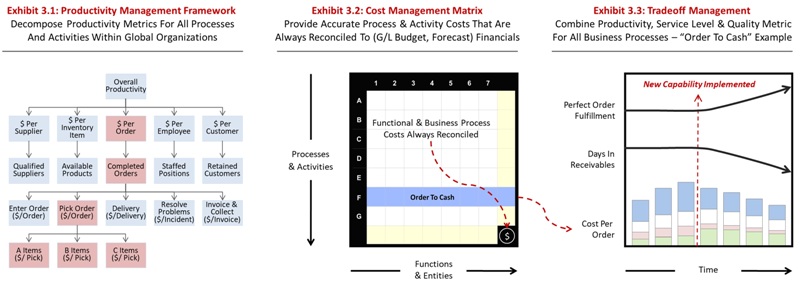
The first benefit is greater performance transparency.
One that is rooted in a deeper and shared understanding of the economics of the business. Productivity metrics can be decomposed from top to bottom using a framework like the one illustrated in Exhibit 3.1. For example, for the “Order to Cash” process, “cost per order” can be decomposed down to “cost per pick”, for high, medium and low volume inventory (or A,B & C) items. What’s more, these productivity metrics can be managed by product, customer and segment, across legal entities.
The second benefit is that the organizations can more effectively drive continuous improvement and cost reduction.
This is because they have readily available access to accurate business process and activity costs. This is achieved with a cost matrix (illustrated in Exhibit 3.2) that reconciles functional (i.e. chart of accounts) costs to business process and activity costs – at all times for actuals, budgets and forecasts. Not only can organizations track cost reduction efforts, but they’ll have an ongoing inventory of cost reduction opportunities.
The third benefit relates to breaking down functional silos.
This is achieved by focusing people on key tradeoffs for all business processes and the activities that comprise them. For example, in an order to cash process (illustrated in Exhibit 3.3), the three “Tradeoff Metrics” are perfect order fulfillment, days in accounts receivable and cost per order. By focusing people on balancing these conflicting measures across functions and entities, organizations can establish a formal mechanism for optimizing business performance.
The fourth benefit pertains to value alignment.
This is achieved by establishing shared rewards for managing tradeoff measures. For example, in order to cash process, tradeoff measures are defined for component activities such as order entry, fulfillment, delivery, invoicing and collection. However, the majority of rewards are based on the ability to achieve the overall tradeoff measures. As a result, people are motivated to make decisions that optimize performance of business processes and the organization as a whole.
Value and Benefits
From a process perspective, one of the most important benefits of productivity management is that it enables more effective rolling forecast processes. Without functional silos to obstruct the process, resources can move more freely between functions and entities. Moreover, the cost and cycle time of these processes can be significantly reduced.
Collectively, these benefits create tangible business value in two ways. First, by removing one of the primary obstacles to consistent strategy execution: functional silos. Another is by reducing complexity costs, which can amount to 5% of sale in global organizations. I wrote about this in a previous FP&A Trends article, which can be accessed here.
These benefits and value make productivity management an essential capability for value-focused Finance executives. Especially in complex organizations where functional silos have undermined operational excellence and other horizontally-driven initiatives.
By embedding productivity management into planning and performance processes, finance executives can play a more prominent role in executing strategies that drive profitable growth and competitive cost structures. All while making financial functions and processes more cost effective.
The full text is available for registered users. Please register to view the rest of the article.
Related articles

FP&A teams have been growing in popularity because they have always known about one big thing...

The Value Cycle is our approach at redefining FP&A’s role in the organization. To take a...

Mature driver-based planning models are an essential component of effective rolling forecast processes in complex, global...

The cost of complexity can be significant – upwards of 5% of sales in global organizations. Forward-thinking...

Integrated Financial Planning (IFP) and Integrated Business Planning (IBP) mean different things to different people. Primarily because...
+
Subscribe to
FP&A Trends Digest
We will regularly update you on the latest trends and developments in FP&A. Take the opportunity to have articles written by finance thought leaders delivered directly to your inbox; watch compelling webinars; connect with like-minded professionals; and become a part of our global community.