

Maintaining or increasing profit margins is key to the development of a company, but in many...

How to Manage Profitability in Uncertain Times
January 11, 2022
There is no hiding that companies had to look hard and rely on deep financial analysis to weather a storm like most of us witnessed in 2020. One of the key components was the growing focus on the Profitability of their services and products line. Profitability became front and center, whether it was via cost management or revenue or investment management or ALL of the above. The FP&A Trends Webinar, which was sponsored by SAP was devoted to the subject of Managing Profitability in Uncertain Times.

Figure 1
Profitability Management
We learnt that Profitability is more than revenue minus cost. While that may be a traditional way to explain or model profitability, however, now in changing times Profitability holistically is a combination of the seven dimensions from the above picture as shared by Larysa. (Figure 1) For example, along with revenue, costs/expenses, it also is important to know the life cycle of the product, or the entire product portfolio and its business drivers. Macro concepts like the business sector and economy also play part in arriving at profitability holistically. During the webinar, there were three viewpoints on profitability discussed in great detail.
- Academic point of view: Presented by Monte Swain, Professor of Accountancy at Brigham Young University. The academic point of view was focused on the DuPont model from 1914. It is as clean as it can get where we look at Investment turnover ratio times profit margin to arrive at ROI. Computationally, as we peel each layer of the model we learn that at the core of all of the calculations is Sales, Investment and Costs. DuPont model gives us the key computational building blocks. The step further, using PACE™ we see that all of these impact Profitability not linearly but more like interconnected. (Figure 2) So much so that the heart of any strategy management lies the Profitability Analytics of these three key components. How I interpret professor Swain’s model is more like a continuous loop applied at all stages of strategy for all the three ROI factors to make it comprehensive. Formulation, Validation & Execution stages happen across Revenue Management, Cost Management, and Investment Management sides to make up for these 6 segments of the model that organisations can harvest value from. And then the whole process iterates to keep adding value.
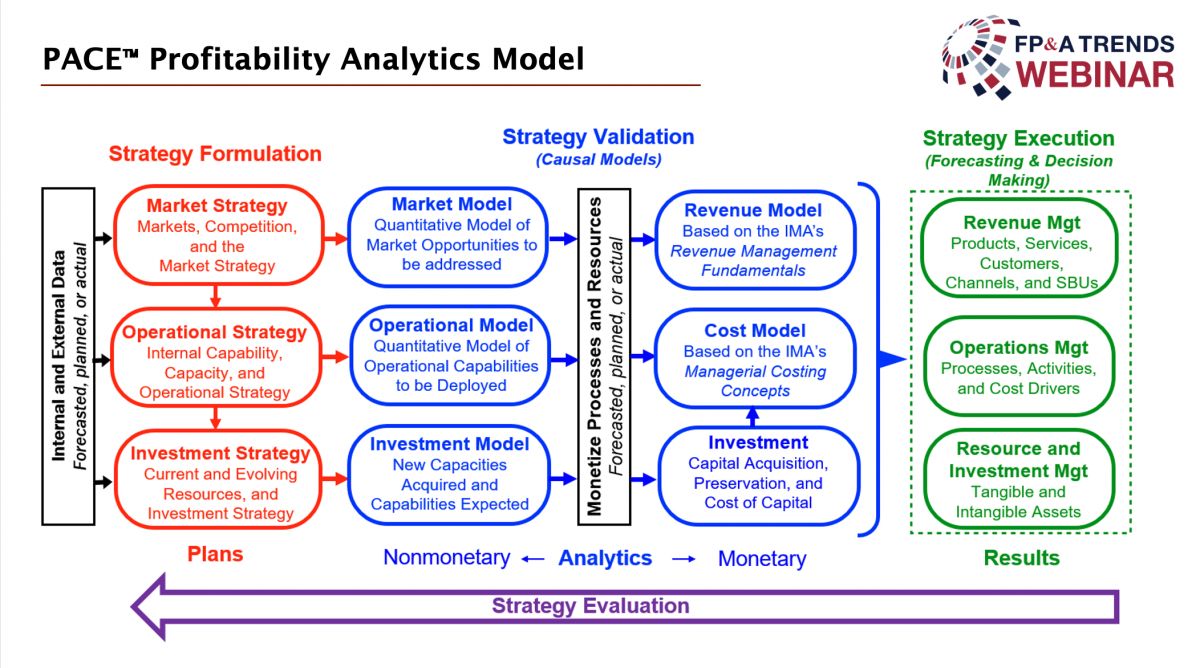
Figure 2
- Practitioner point of view: Presented by Robert Ycmat, Chief Financial Officer (CFO) at Revere Health, Utah. The practitioner point of view talked about the FP&A workflow model applied at Revere Health from the strategy formulation stage to the execution stage. It undertakes the concept of how some costs are not directly associated with a particular product or service but is important for the calculation of Profitability and performance across the company. Shared revenues and shared costs once allocated correctly, help arrive at Profitability appropriately. Then, the P&L is accurately generated at the most granular level or at the enterprise level. Needless to say, this is due to good knowledge of business drivers which is possible with a good partnership between finance and business teams across the organisation. Here is an example workflow that Robert shared where the finance ops metrics relevant for the current strategy was designed where the source data was manipulated to match the allocation methodology using stakeholder approved rules to automate the system. The end result was a well-allocated revenues and expenses relying on multi-sources data, generating 800 P&Ls!

Figure 3
- Technology point of view: Presented by Michel Haesendonckx, Global Solution Owner Financial Planning & Analysis at SAP SE. The poll before this piece of presentation shed a great deal of light on where we want to go vis-à-vis where we are today in leveraging the technology for Profitability management. 54% of the poll takers use only Excel for all their profitability reporting and analysis and only 10% use sophisticated ERP systems in their company. This is a huge area of opportunity where if we can collectively leverage technology or automation then speed and depth can be achieved, and we will be able to sail through the uncertain times a little smoother!
- Something very interesting that stood out to me is in the below two slides - the power of well-connected data sources. Once you have all your clean data sources connected there are tools now where you can type your question and the answers would pop up in cool visualisations. Extremely powerful and is almost like having a personal analyst to talk to 😊

Figure 4
Figure 5
Conclusion
The webinar reinforced that as a finance professional one of the key areas of focus in times of change, crisis or success is to gauge Profitability. To best way to support our business partners and company is to learn the drivers behind the sales, costs and revenues. Aligning that with corporate strategy and leveraging technology to be able to create holistic profitability steering us right to the future.
We would like to thank our global sponsor SAP for great support with this FP&A Trends Webinar.
The full text is available for registered users. Please register to view the rest of the article.
Related articles

One of the most important aspects of the FP&A role is to be able to provide...

Using P&L as a map for the journey (see image 1 below), the first three articles...

This series of articles focuses on blowing up this stereotype by demonstrating how Finance in general...
+
Subscribe to
FP&A Trends Digest
We will regularly update you on the latest trends and developments in FP&A. Take the opportunity to have articles written by finance thought leaders delivered directly to your inbox; watch compelling webinars; connect with like-minded professionals; and become a part of our global community.