
Challenging market and rising costs put businesses into a non-stop race for efficiency and expense reduction...

Drivers of Inflation in 2022, and How FP&A Can Prepare for It
October 11, 2022

Agility, Scenario Planning, and macroeconomic forecasting are three key factors in enabling FP&A to guide companies in the way they need to.
In this article, we will explore some of the macroeconomic theories driving the current inflationary environment. These theories will allow you to understand, model, and advise your company on its options for addressing chaos and uncertainty. It is the responsibility of FP&A professionals to ensure our companies don’t “sink in the storm”. If acting correctly, we can pilot our companies through these unpredictable times, ensuring they survive and thrive.
Macroeconomic Driver Theory
There are two major camps in inflationary theory. The first is Monetary Policy, and the second is Supply Side Disruptions. Within Supply Side Disruptions, there is a significant sub-category which is primarily based on Energy Supply which we will explore. All of these theories agree on the drivers of inflation are caused by cash in excess supply.
Here’s a super simple micro-economy that illustrates how these concepts work. If we have an economy which consists of 100 units of FP&A widgets, and the central bank has 100 currency notes called pandas, then each FP&A widget is worth roughly one panda. If the central bank or government prints 30 more pandas without any changes in the number of FP&A widgets, then roughly 1.3 pandas now buy a widget. Now, if the supply of widgets drops by 30% on printing more pandas, then we have 70 widgets and 130 pandas, making each widget cost 1.86 pandas. That’s 86% inflation. A panda used to be able to buy a widget; now, a panda is only able to buy 54% of a widget.
-
Monetary Policy
Monetary Policy around the world increased money in circulation as a response to Covid. In 3 years, the increase was 30% globally; 50% in the US, 87% in the EU, 41.5% in India, 17% in China, 32% in Brazil, and over 400% in Canada. In normal times, the vehicles used by central banks to increase money supply are called Quantitative Easing, which is an investment in a business that should, in turn, increase production at a relative scale. This round of money increase through deficit spending or Covid stimulus was much less productive in terms of economic return and is thus driving inflation instead of economic growth.
-
Supply Side Disruptions
Supply Issues around the world have been painful and created short-supply ripples through most industries that we are dealing with today. For example, Covid shutdowns and the Zero Covid policy in China were a direct cause for Toyota to miss its June 2022 production forecast. US ports experienced huge delays in 2021, as we can all remember the number of ships off the port of LA. These delays caused further delays throughout the tens and hundreds of steps that each product we consume goes through. Energy has been affected similarly, as oil production fell and struggled to return to the same speed when demand recovered in 2021 following the shutdowns.
Energy Supply
For the last 150 years, energy demand has been highly correlated with Global GDP. Therefore, any increase in the cost of energy will result in a decline in GDP roughly 12 to 18 months later. There are many efforts to reduce the demand for energy through efficiency improvements and energy source replacements. Physics dictates that those efforts are engineering feats that take decades and that they can still not reduce the final demand, just the input fuel to fulfil that demand.
Every category of the Consumer Price Index requires energy to produce and deliver its goods and services. Even with modern supply chain systems that can handle price volatility, the current volatility is so high that it will impact the cost of goods and services throughout the supply chain.
Modelling the Impacts of Macroeconomic Drivers for Your Business
Whether or not you think you know which macroeconomic model is the right one for the global economy, you only need to know which one is the most relevant for your business. Each business lives in a different part of the overall supply chain, so some will be highly impacted by supply-side commodities prices or energy prices. In contrast, some will be impacted more significantly by the general purchasing power of currency reducing and have more relevant impacts from monetary policy.
-
Target a Realistic Model Fidelity Level
There are five fidelity and capability model levels for business and finance:
- Directionally correct
- Order of magnitude correct able to determine “house or mouse” impact levels
- Deterministically capable: able to predict within 20% with a ranking of importance
- Driver-Based deterministic: with explicit relationships between inputs and outputs
- Probabilistic: able to quantify point-specific accuracy and quantify drivers of uncertainty
When you’re modelling the impacts of macroeconomic factors, it is important to keep in mind that you won’t be able to build models at the fidelity level that you or your leadership are used to. But it is still precious for decision-makers to deliver a lower fidelity model if it is the best available. First, strive to quantify directional relationships between your revenues and your costs with each macroeconomic theory separately. Then, when those have been validated, focus on moving up the capability ladder.
-
Validate Your Models with Experts
When building models for a new business, it is the best practice to validate model inputs and outputs with experts within the industry. This step is less important for FP&A teams that have been modelling a business for quite some time FP&A teams that have been modelling a business for quite some time. However, during these uncertain and unprecedented times, it is very important to add this step back into your process.
Advising Your Company Through Scenario Analysis
Economic theory and modelling aim to highlight options and impacts to business decision-makers and pre-determine a plan of action for each scenario.
-
Presenting Scenarios
When you present an analysis of macroeconomic factors, consider that there are seven basic categories of impact on cash and profitability and build a table of how the possible outcomes will impact each type. A sample table is provided below.
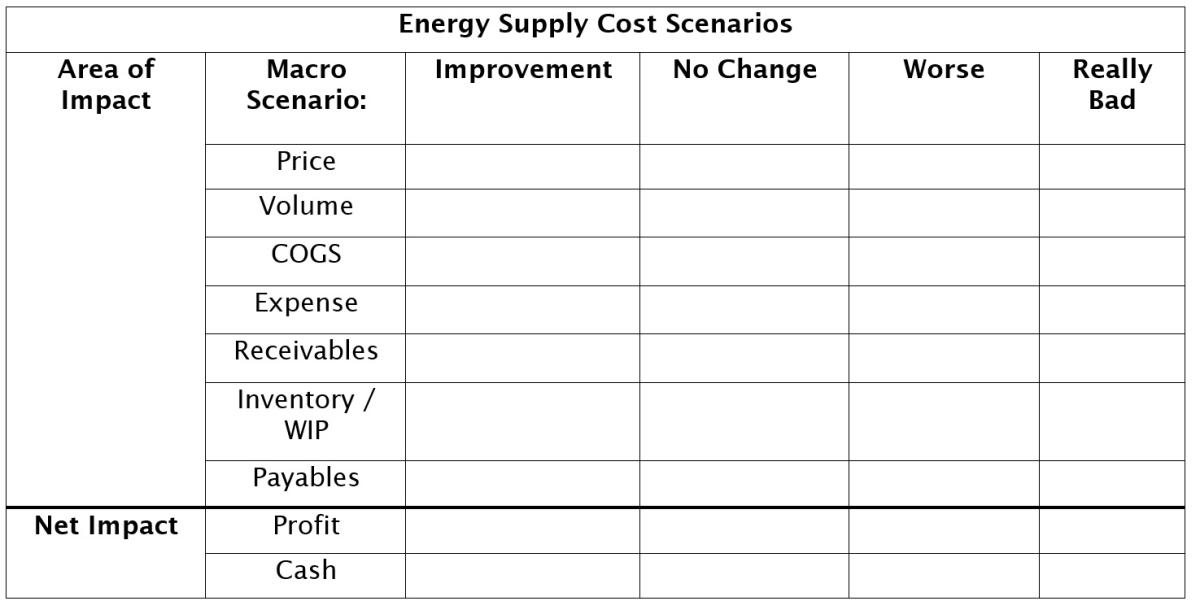
Table 1: 7 Basic Categories of Impact on Cash
-
Scenario Planning
With the possible outcomes listed in the table above, you can start to build a plan of action for each Cost Scenario threshold. If possible, set a numerical threshold or describe a trigger point, then have an action plan for each. In many situations, I’ve used the DEFCON nomenclature for critical items; this allows finance and leadership to specify and name a level of urgency and the actions to be taken.
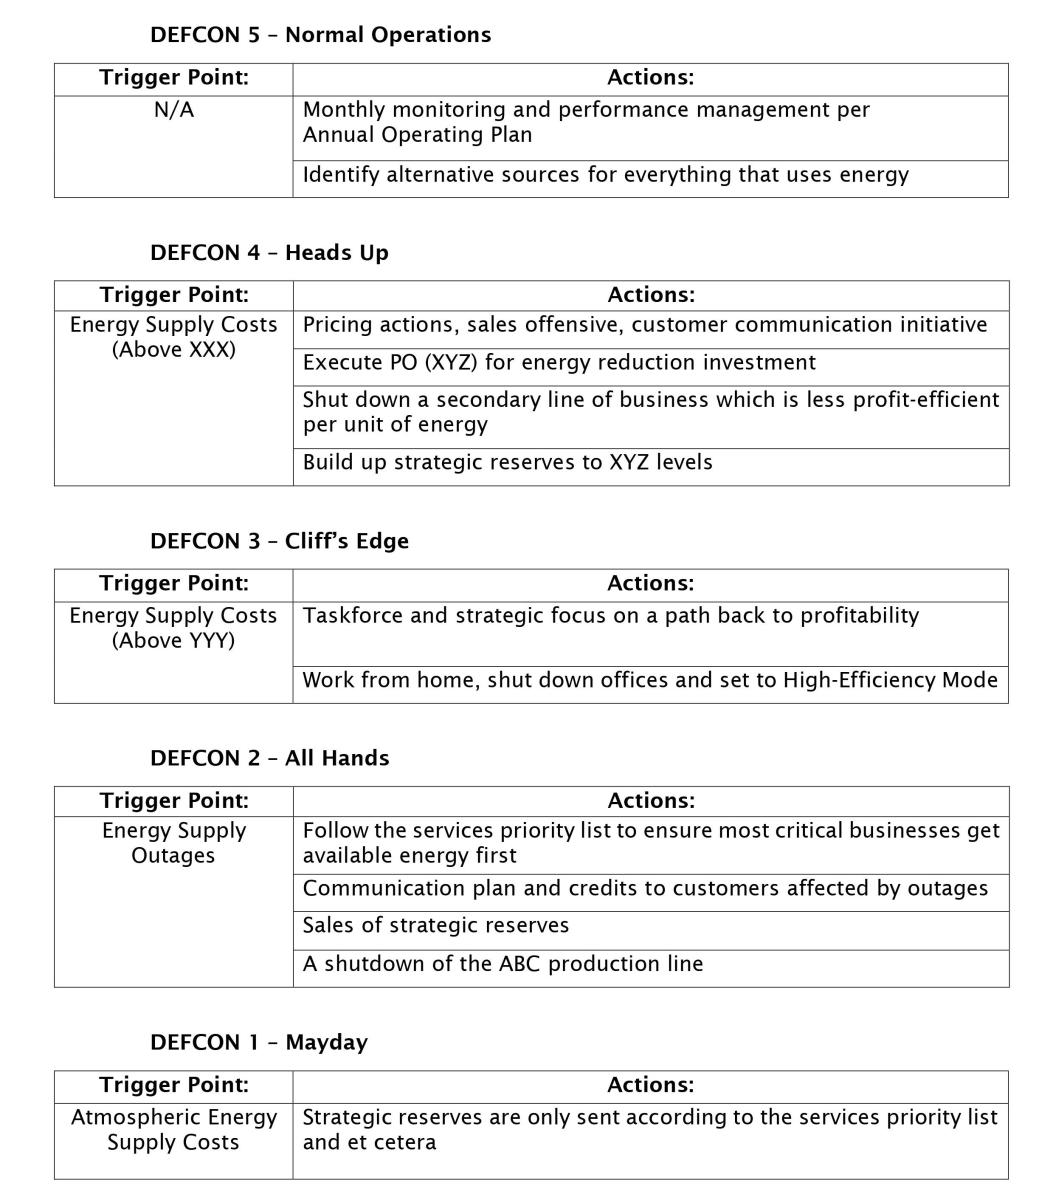
Table 2: Possible Outcomes of Different Scenarios
Conclusion
Businesses struggle to forecast sales and profitability during inflation and recession. This causes companies to close that would have otherwise made it to. It shouldn’t feel impossible to see what the future of your business looks like in any market condition. This is why we’re here to help enterprises to maximise profitability during market uncertainty. Better forecast visibility produces better decisions and better outcomes that save businesses and jobs.
The full text is available for registered users. Please register to view the rest of the article.
Related articles

There is no hiding that companies had to look hard and rely on deep financial analysis...

For FP&A in today’s business climate, agile planning is basically the speed and flexibility with which...

In my day-to-day job, I interact with many Financial Planning and Analysis (FP&A) organisations implementing predictive...
+
Subscribe to
FP&A Trends Digest
We will regularly update you on the latest trends and developments in FP&A. Take the opportunity to have articles written by finance thought leaders delivered directly to your inbox; watch compelling webinars; connect with like-minded professionals; and become a part of our global community.