This article explores the pivotal role of Business Intelligence (BI) in enhancing strategic decision-making within large...

Is AI the New GPS for FP&A?
October 21, 2025

Having been working in management information/dashboards for the past 25 years, it feels like every 5 to 7 years, new tools and innovations come along that promise to make all your information needs disappear, with the primary aim of helping business leaders make better predictive decisions. See the Appendix for a simple chronology that outlines the evolution of Business Intelligence tools over the decades and sets the backdrop for why today’s dashboards and AI capabilities feel both powerful and overwhelming.
Many of us will remember working with Business Objects until it was bought over by SAP in 2007, and it has been a dominant player ever since. In 2025, the choice of BI tools is large with the likes of Power BI, Tableau, Qlik Sense, ThoughtSpot, Zoho Analytics, Hex, Definite, Databox, Improvado and others. [1]
Now, we can all agree that the data visualisation capabilities have improved vastly and that, powered by AI tools that can translate voice commands, etc, is making accessing key pieces of information much easier.
However, in my opinion, this creates two problems that are very similar to the problems faced by the Car Dashboard.
The key problems are:
- Information Overload to the point it becomes a distraction
- Understanding what information is required to make a positive intervention
Let’s take each of these interns.
Information Overload
None of us was around when the car was invented. At the time, it was the most innovative product. Figure 1 below shows the dashboard of a 1911 Ford Model T Torpedo Runabout. You can see that the instrument panel only consisted of the speedometer.
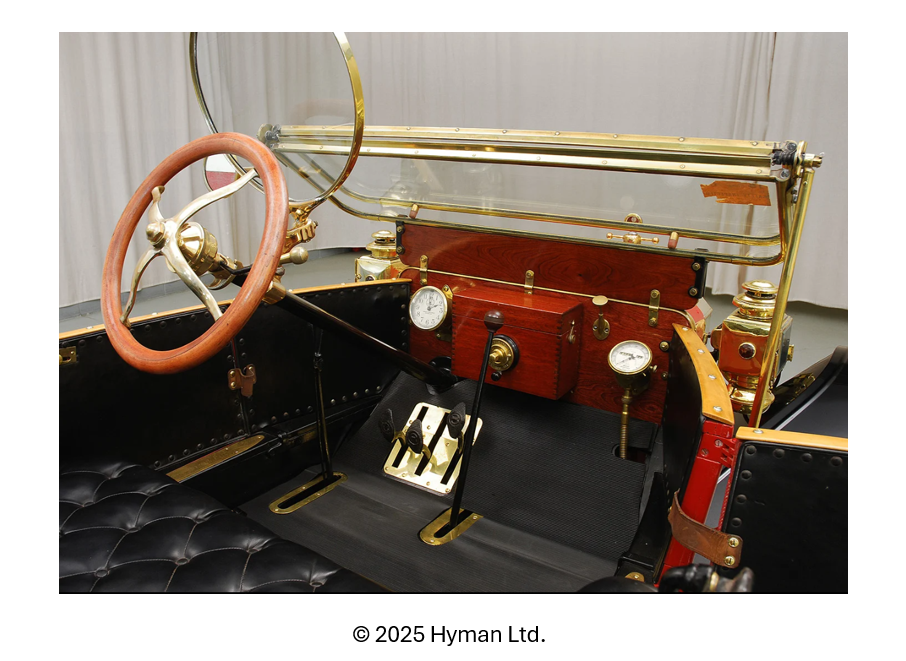
Figure 1. 1911 Ford Model T Torpedo Runabout
Why was this?
There were many reasons, but some of the more important ones were that speed was the most crucial thing for a driver to monitor. Everything else was visible, and if something were to go wrong, the driver would see something break or belch smoke, etc.
At the time, given that driving was a relatively new skill and only a few could do it, they didn’t want to distract the driver and allowed the driver as much freedom as possible to concentrate on the task of driving.
In 115 years, cars have evolved in every possible way. Safety, speed, and comfort, but with each of these developments, they have also become more complex, and now a dash-panel will often give the driver access to more than 50 controls with almost limitless customisations.
As shown in Figure 2, the Tesla dashboard now features an estimated 45–55 accessible options, ranging from driving and navigation to media, climate control, and software updates. This explosion of choice is powerful, but it illustrates how complexity can quickly overwhelm the driver. The same holds true for FP&A dashboards, which often present dozens of indicators when leaders may only need a handful of trusted signals.
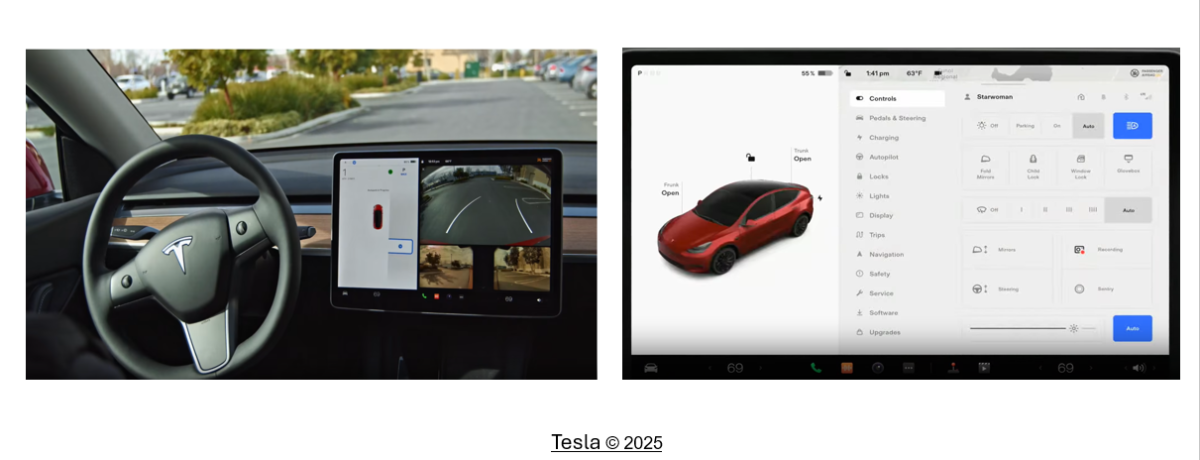
Figure 2. 2025 Tesla Model 3 Dashboard
Ironically, the responsibility of the driver still remains largely the same as in 1915: get your passengers safely to where they want to go!
The skill of ‘driving’ has become far more common than it was in 1915. However, has the driver's competence increased?
Some may argue that, with all the technical improvements, drivers do not need to be as skilled at driving as their predecessors, and they certainly don’t need to know as much about the car's mechanics. The older cars were far simpler, which means the driver could and often needed to do running repairs during a journey. They became good at it. Now, as soon as a dashboard light comes on, you will call a specialist, and the modern car has gone a step further, where the car informs your dealer, and they will often send you a message saying your car told them …… and you need to come in to fix it.
Far more convenient and much better-maintained vehicles, however, far less skilled drivers at diagnosing problems.
Doesn’t This Feel Like Organisational Dashboards?
As the complexity of organisations tends to constantly grow, largely due to expansion, management teams think they need and often want information in multiple ways. This fact sustains the BI industry, and the tools are more flexible to support this pursuit.
So, management information needs also expand, and a whole industry of analysts and data engineers has emerged. The visualisations have become far more complex and bring together multiple sources of data, and try to show lots of different connections, etc.
However, does it truly help the ‘Driver’ (the CEO) navigate the business any better than his / her predecessors of 50 years ago?
Depending on your business, some may argue that all this MI is more distracting than truly revolutionary and comes at a hefty cost. According to the 2025 FP&A Trends Survey, only 44% of organisations rate their forecasts as highly accurate or good. Among those with best-in-class data quality, this rises to 79% — but drops to just 22% where data quality is poor. This reinforces the point that while dashboards are becoming more powerful, their effectiveness depends less on the number of indicators shown and more on the reliability of the underlying data.
This is a more challenging skill than simply trusting your gauges. In the 1911 Ford Model T Torpedo Runabout example, a driver would not need to question the speedometer, as there was only one gauge, which had been tested and validated. In modern cars and businesses, there are multiple sources and multiple providers of dashboards. The skill of the CEO / senior management team is to distil all this information and only use what is most relevant for the decision they are trying to make, this often takes more time, discussion, reanalysis and skill than in the past.
This leads to the second problem.
Understanding What Information Is Required To Make Positive Intervention
I often think of this in the same way as our use of GPS.
GPS started as a US military project in the 1960’s and was officially launched in 1973 for civil use. The expansion of its use began as satellite technology expanded, but what is more interesting is that in the early 2000's the GPS spawned an entire industry of devices which had to be bought in a car (for example, TomTom). This was all the rage at the time, but it soon disappeared as GPS technology was included in mobile phones and now directly into car dashboards.
It has now become second nature for all of us to use GPS technology, and many of us will be lost without it. It is hugely helpful to avoid traffic and show us the fastest route between 2 places (so as to make positive interventions to our journey).
However, the whole value of the GPS relies on one fundamental thing that it still can’t do for you.
You, the user, need to tell it where you want to go!
To me, it is no different from what happens in business. Modern dashboards, MI, and now AI-powered MI are like a sophisticated business GPS. The term ‘Digital Twin’ is being used more and more.[2]
This again was introduced in the 1960’s by NASA as a means of modelling the Apollo missions and generally consists of 3 things:
- A physical object or process and its physical environment
- The digital representation of the object or process
- The communication channel between the physical and virtual representations
However, it still relies on the user specifying the scenarios to model, and it attempts to map out the best path to achieve them.
Therefore, a skilled CEO needs to use their MI like they would a GPS, and there are still lots of times when driving when you will not need to use a GPS, or sometimes you need to make a conscious choice to ignore it.
Conclusion
There is no doubt that data in a governed and understood way is hugely helpful in supporting decision-making, but we must not forget that CHOOSING DESTINATION is still a human skill and must never be underestimated.
MI Dashboards help navigate and monitor organisational performance, and soon, there will be other mediums by which this information will be accessed by the end user when required. But in general, you shouldn’t allow the data on its own to manage the destination your business is heading.
Sources
- https://sranalytics.io/blog/top-bi-tools/#:~:text=The%20top%20BI%20tools%20in%202025%20are%20Microsoft,Zoho%20Analytics%2C%20delivering%20AI-powered%20insights%20and%20self-service%20analytics.
- Digital twin - Wikipedia
- https://hymanltd.com/vehicles/5276-1911-ford-model-t-torpedo-runabout/
- https://www.tesla.com/support/videos/watch/heated-steering-wheel-model-3-and-model-y
Appendix
History & Evolution of Business Intelligence Tools
| Stage | Timeline | Description |
| Reporting | 1960s – 1980s | The focus is on basic reporting capabilities, utilising static reports to present historical data. |
| Decision Support Systems (DSS) | Late 1970s – 1990s | Introduction of interactive systems allowing users to explore data and make simple decisions. Incorporates features like ad-hoc querying and multidimensional analysis. |
| Online Analytical Processing (OLAP) | 1990s | OLAP technology enables interactive analysis of data from multiple dimensions, facilitating in-depth insights into trends and patterns. OLAP cubes have become popular for organising and visualising multidimensional data. |
| Data Warehousing | 1990s | Organisations integrate data from various sources into centralised data warehouses, providing a unified and consistent view of enterprise data. |
| Data Mining and Advanced Analytics | Late 1990s – 2000s | Introduction of data mining and advanced analytics. Statistical methods and machine learning algorithms are employed to discover hidden patterns, correlations, and trends within the data. Predictive analytics becomes crucial for forecasting and decision-making. |
| Self-Service BI | 2010s | User-friendly BI tools empower business users to create their own reports and analyses without heavy reliance on IT. Self-service BI platforms allow independent access and visualisation of data. |
| Big Data and Real-time Analytics | Mid-2010s – Present | Rise of big data technologies and real-time analytics. Organisations handle large volumes of diverse data sources, including streaming data. Real-time analytics becomes crucial for decision-making in dynamic business environments. |
| Cloud-Based BI | Present | Cloud-based BI solutions gain popularity for flexibility, scalability, and cost-effectiveness. Cloud platforms enable easy access to BI tools, collaboration, and data storage. |
| AI and Augmented Analytics | Present and Future | Integration of AI and machine learning into BI processes. Augmented analytics leverages AI to automate data preparation, discovery, and insight generation. Natural Language Processing (NLP) and machine learning enhance accessibility and usability of BI tools. |
The full text is available for registered users. Please register to view the rest of the article.
Related articles


In today’s world, companies need more than ever fast insights to make the appropriate critical moves...

The expanding role of the modern FP&A requires more than even a deeper understanding of the...

4-5 years ago in Microsoft, Cloud business was a small portion of the overall business, but...

This article explores frameworks for developing FP&A dashboards and tells us how FP&A professionals can design...

The promise of global dashboards is simplicity — one version of the truth. But truth without...
+
Subscribe to
FP&A Trends Digest
We will regularly update you on the latest trends and developments in FP&A. Take the opportunity to have articles written by finance thought leaders delivered directly to your inbox; watch compelling webinars; connect with like-minded professionals; and become a part of our global community.
ARatnani
October 29, 2025
Thank you