When the graph is the right way to present your FP&A information, several important questions should...
 Something was wrong. Maybe I was wrong, or my data, or the budget. The only one who wasn't wrong was my business partner, or so he'd have me believe.
In his defence, what I told him contradicted everything he believed. My report showed his team was falling short of their top and bottom-line targets, with sales per head declining and commissions steadily rising. The data was so clear—so cut and dry—that I figured the report would speak for itself, and I would get a simple "thank you" email in return.
Instead, I got an unexpected personal visit to tell me he didn't believe it. He had been working hard to turn the business around from a low-performing division, staffing the right departments with the right people, and his dashboards showed his efforts were working! The organisation was steadily improving its sales delivery quarter-over-quarter, and with such impressive performance, the commission payouts were more than warranted. So, in his mind, something of mine had to be wrong.
In hindsight, I was wrong, although not how he had thought. Thinking it was my job to inform him of what was happening in his business, I had approached the subject with the subtlety of a stampeding elephant, with no regard for what he cared about most. Rather than building trust, I sewed division.
My obligation in this situation wasn't to inform but to persuade. And the easiest way to persuade is to tell a good story.
Why FP&A Needs to Be Master Storytellers
To some, the concept that FP&A professionals must present a compelling narrative to succeed in their position may seem counterintuitive. We rely heavily on data, so why not allow the data to speak for itself?
As intuitive as that is, it's rarely that simple for two key reasons:
1. Data can set the scene but can't tell a story.
When you rely on data to tell the story, you invite the audience to contrast it with their own facts and experiences. These debates are rarely about what's true – often, it's all true! – but rather about what's relevant. Without providing the context of why your data is relevant, the discussion quickly turns from what the data says to whose data to use. As Homer Simpson once said, "Facts are meaningless. You could use facts to prove anything that's even remotely true!"
2. Data doesn't inspire change.
In his book, The Happiness Hypothesis, Jonathan Haidt suggests that we effectively have emotional and logical brains.
He equates the emotional brain to an elephant: it can break through almost any obstacle when desired, so long as it knows where to go. The logical brain is a rider atop the elephant: blessed with perspective to see the path but lacks the strength to make the elephant go anywhere it doesn't want to go.
This framework is valuable because it provides a way to evaluate if your message resonates. If you see nodding heads in the meeting but no action afterwards, you've only appealed to the rider who grew exhausted trying to get the elephant to move. On the other hand, if you see a flurry of activity but no cohesion amongst the participants, you've likely motivated the elephant without appealing to the rider.
It's easy to see where I went wrong in my approach. I should have anticipated that my report would surprise my business partner and started with a shared perspective that connected the dots between what he and I saw. Furthermore, knowing that he invested in the turnaround plan, I should have tapped into that motivation to demonstrate how we were on the same side rather than inadvertently challenging his worldview outright.
In short, data is a critical component in influencing the business, but it is not the sole component. To create a shared perspective and tap into your audience's motivation, you need a narrative that gives the data soul. A message crowds out the natural questions of what's happening to make room to discuss what to do next.
This is where storytelling comes in.
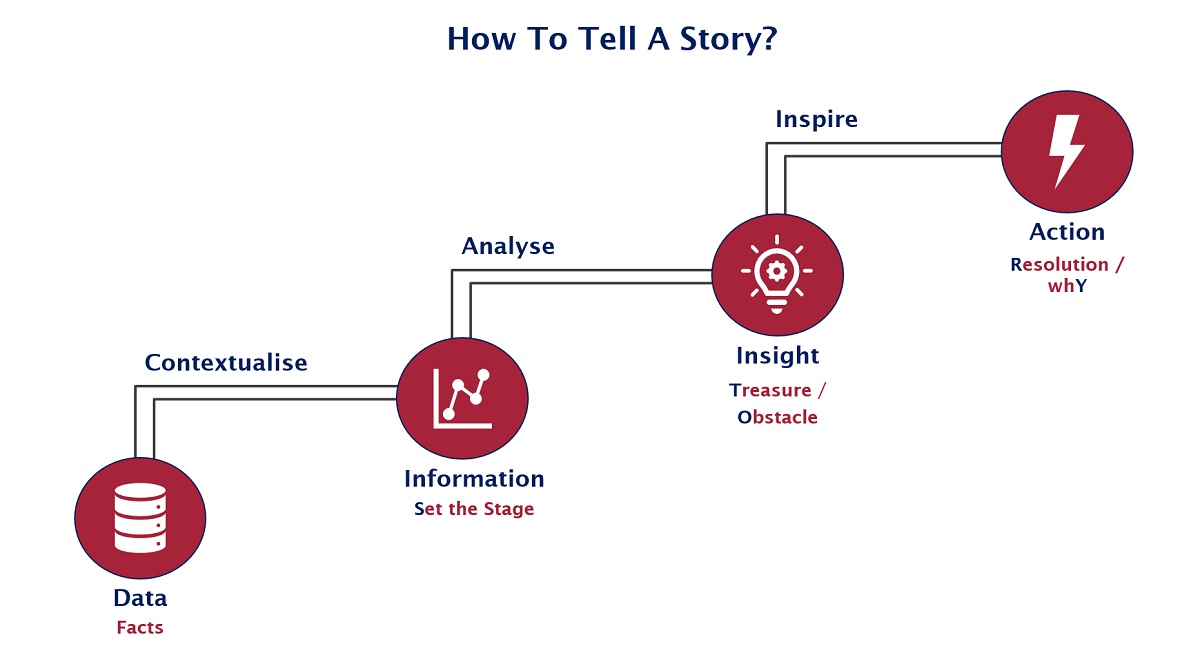
How To Tell a STORY

Figure 1: Telling the Story in 3 Steps
When you need to persuade, STORY is a multi-step process that provides context to the data and inspires your audience to act.
Set the stage
Convert your data into information by wrapping it in the appropriate context. In this step, you focus only on what should influence the decision and leave the rest of the data behind to keep the waters clear. In addition, you should address what the audience expects to see and, to the extent necessary, why it's irrelevant to this particular discussion.
In my example, I had to address the data the sales leader was looking at, quota attainment per rep. The problem with this metric was that it didn't account for differences in departmental quotas when aggregated. As the sales leader changed the staffing levels, he inadvertently staffed lower quota-carrying departments, making it almost impossible to hit the organisation's targets even as the individual rep attainment rose! Walking him through that data and then flipping to an aggregated view of dollars per rep made it abundantly clear that there was a problem to solve.
Highlight the Treasure/Obstacle
By highlighting what your audience wants (emotional) and what's in the way (logical), you can deliver insights that appeal to both their rider and elephant. In this step, addressing the underlying wants is critical rather than the stated ones. For example, most leaders will say they want to stay on budget, but they may argue that the best way to hit the annual sales budget is to hire the way-too-expensive VP today so they can uplevel the team and over-deliver in the final quarter.
In the sales leader example, he cared about turning around the organisation and maintaining the trust of the team whose performance he had been celebrating. He needed to save face while delivering the message that they needed to do more. This was a tough needle to thread, but with that mutual understanding, we could craft a story for his direct reports that celebrated progress and outlined where we needed to improve.
Align on a Resolution & Reinforce the "whY"
Once there's alignment on what the obstacle and treasure are, the actions required to resolve the tension take shape quickly. It's critical to document that resolution and tie it back to why taking action is essential. Remember, the elephant requires motivation and direction, and the more you can highlight how the two connect, the more likely the problem will be solved. Furthermore, that documentation will serve you in the future as a way to speed up the decision process when similar issues arise.
Conclusion
In conclusion, stories enable us to reach our audience in a way that data alone can't. When our audience rejects the data outright or fails to act even if they agree with what the data says, you'll want to consider crafting a narrative that appeals to their rider and elephant.
Building a story around data can be intimidating, but remember the simple formula above. When you contextualise the data so that it is intuitive for the audience and highlight how it can resolve the tension between what they desire and what's in their way, you'll have the makings of a captivating story.
Subscribe to
FP&A Trends Digest

We will regularly update you on the latest trends and developments in FP&A. Take the opportunity to have articles written by finance thought leaders delivered directly to your inbox; watch compelling webinars; connect with like-minded professionals; and become a part of our global community.


