A question frequently asked by businesses of all sizes is what should my Key-Performance-Indicators (KPIs) be...
 Working at a local business unit often doesn’t give you access to sophisticated corporate systems to monitor performance. However, as a financial you are quickly immersed into daily operations, learning how things really work. A sample will be given of key indicators used to improve the cash forecast and position of a business unit.
Business Strategy
To start off, the most important step to take first is to quantify the business objective(s) as much as possible, described in volume, money and time frame. The objective can change with each new planning cycle or change in business focus. During a turnaround, the focus is cash. When setting up a new business, it might be time-to-market. A clearly defined objective helps to focus on the relevant cost and expense items to control and forecast.
Standard Model
Use a model as a framework to understand the business process when selecting the KPI's. Any model will serve, as long as it is simple to communicate. The idea is that the selected KPI's serve the business objective, are transparent, and provide the possibility to be operationally involved.
For each step, define a few KPI’s. Have at least one KPI linked to another stage in the model and one PI related to quality. Of course, measuring the activity itself is also very useful. This gives way to identifying the ‘real’ business drivers for budgeting and risk management purposes, and for the possible implementation at a later stage of e.g. Activity Based Costing or Business Intelligence.
A Sample
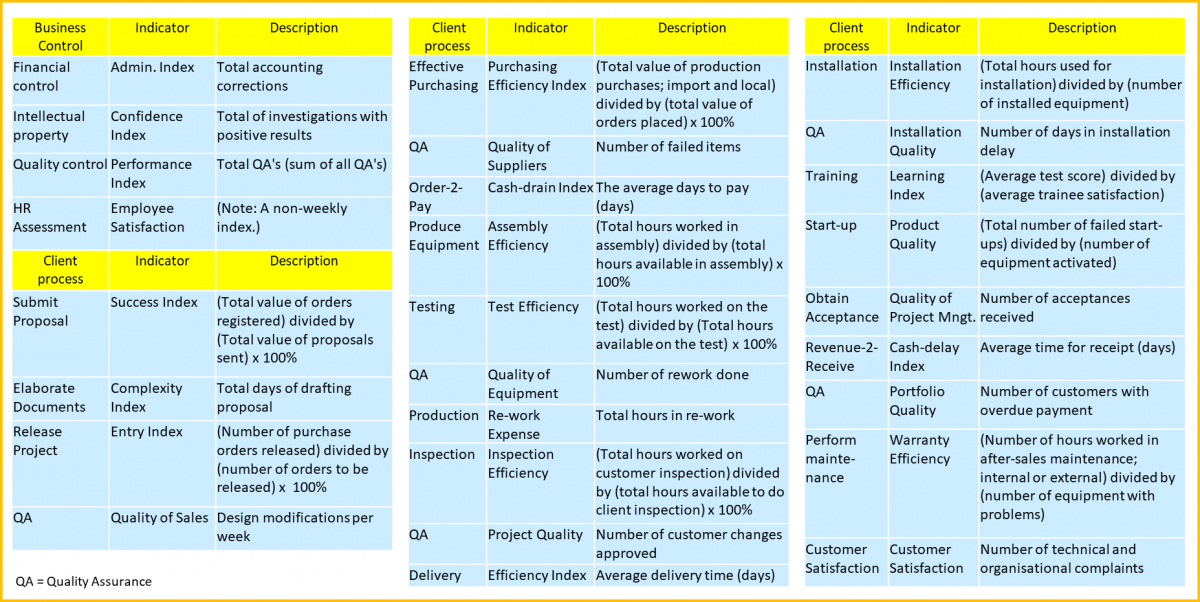
The following sample of KPI's was used by a business unit after a turbulent period. It was presented as a one-pager, in the following order (as a ‘flow’), and for everyone to understand what was being measured: the activity, the KPI, and the ‘formula’.
Street-smart integration
The advantage when being relocated to a local business unit is having the opportunity to explain the corporate strategy and/or to explain the task set out to do. Being transparent about the strategy and how it translates into the business objective(s), results quickly in a buy-in for KPI's from the people doing the work or managing the departments.
Step 1. Discuss with each department head the best KPI’s to use. This results in a joint responsibility to make it a success. Also, make the manager and the assistant-manager, both, responsible for the indicator. You want the manager to focus on clients, people or suppliers and not feel obliged to always be at the weekly meeting, and you want the assistant to grow into management.
Step 2. Measure, test, adjust and learn, together; before, during and after the operational meetings.
Step 3. Publish the indicators on Monday; have the operational meeting on Wednesday. This gives the team time to discuss deviations and prepare solutions. Team performance will increase, eliminating the ‘blame-game’, and there will be no need to micromanage.
Step 4. In case the deviation is too large or strange, leave the desk and pop-in for a quick check if the manager wants finance to be involved too.
After a few weeks, the operational meeting should take no more than 30 minutes; even with over 30 KPI’s and 15 people attending. After the identification of KPIs, these operational meetings will bring deep understanding into the ‘real’ business drivers. This is essential for anybody advancing in FP&A.
To conclude, being the lead at these meetings increases the ability of the financial to tell the story behind the numbers. This is important when reporting changes to the CFO, in e.g. the Rolling Forecast or the Risk Impact estimates. In addition, it gives the financial the opportunity to assist management with funding requests. Using this simple approach, the financial can integrate quickly into the business and get the buy-in needed for using KPI’s to measure performance and manage improvements.
The article was first published in Unit 4 Prevero Blog
Subscribe to
FP&A Trends Digest

We will regularly update you on the latest trends and developments in FP&A. Take the opportunity to have articles written by finance thought leaders delivered directly to your inbox; watch compelling webinars; connect with like-minded professionals; and become a part of our global community.


