
I like to think of the various EPM/CPM methods as an analogy of musical instruments in...

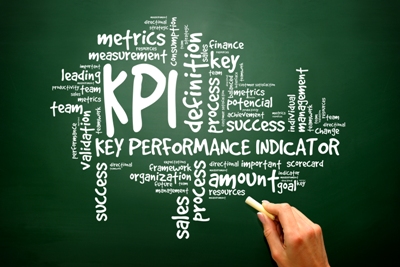
Key Performance Indicators - A CFO's Perspective
March 28, 2018
 "You can't improve what you don't measure" - Lord Kelvin
Key Performance Indicators (KPIs) are metrics that represent how various drivers of the business are performing. These drivers are often both financial and operational in nature. And while there is no one-size-fits-all when it comes to choosing the "right" metrics for your business it is critical that the data used to be consistent and accurate.
What makes an effective set of KPIs?
- KPIs should reflect a mix of strategy and operations
- Effective KPIs require measuring the appropriate data
- Having something to compare this number to
- Having the data in a timely manner while it is still fresh
- Confidence in the accuracy and integrity of the data used
"If you can't measure it you probably can't manage it. Things you measure tend to improve" - Ed Seykota
What KPIs do I need to be tracking?
Unfortunately, there is no default answer because what is important varies not only by industry and maturity of a business, but also by the strategic objectives laid out by the CEO. However, you can't go wrong by examining metrics that provide insight into the short-term viability of the business such as:
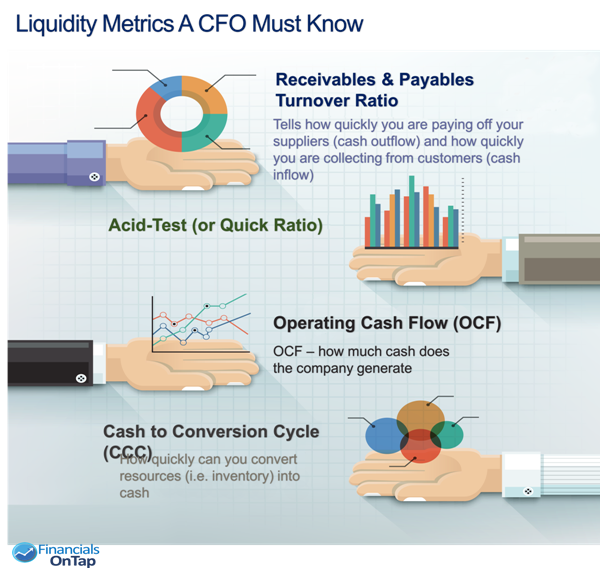
- Working capital - this is the amount immediately available cash
- Operating cash flow - OCF is the cash version of net income (net income is on an accrual basis which means it includes non-cash items like depreciation)
- Liquidity ratios such as Current & Quick ratios - measurements to show if the company can pay off short-term debt
- Cash conversion cycle - this is effectively the amount of time is takes to sell inventory and end up with cash in the bank
How should I start collecting KPIs?
Once you identify the appropriate metrics for your business it is imperative that you clearly define what each indicator represents, why it was chosen, where the data will be coming from, how it will be calculated, etc. You must set one standard definition and one "source of truth" as to where the data comes from. There is nominal value without the ability to compare KPIs to previous periods because there is no context.
"Data is only as useful as the context in which it is gathered and presented" - Josh Pigford
How many KPIs should I track?
Again, there is no right answer, but there are wrong ways of going about it. Too many KPIs began to have a dilutive effect on the value of the information being portrayed. Too few metrics leaves you open to potentially missing critical signals and trends within the business. Most CFOs would agree that any number above 20 KPIs is too many and should be trimmed down, potentially requiring you to reevaluate aspects of the business. Less than 5 metrics may be too few depending on the business and amount of transactions that take place throughout the period.
"Metrics are for doing, not for staring. Never measure just because you can, measure to learn, measure to fix."
How often should my KPIs be updated?
This question requires real consideration, specifically by the person(s) making decisions based off the data. One is likely to think that if you had the option between accessing real-time updates to the necessary data or accessing data that gets updated just once per quarter that the former would be a no-brainer. However, as mentioned previously, data has little to no value without context. In this case, the context needed is data from previous periods to compare against. That said, a period can be any duration of time that you choose but is most often refers to a length of time equal to 1 month, 1 quarter, or 1 year.
I have been reporting one of the metrics incorrectly - what should I do?
First, go back to prior periods and identify what the metric would have been if it were correct. Next, understand: how many periods the metric has been incorrect? How large is the variance from the correct number? What caused the error - bad data or a bad calculation? What decisions or actions have been taken either directly or indirectly based on this bad information?
Once you have a better idea around the true impact and potential fallout from reporting the wrong number you can act appropriately. The worst case scenario would be a public company having to restate and lower a metric previously reported to Wall St. If you find yourself in this unfortunate position the course of action to take is clear, start looking for a new job within a new industry.
Read: "Oops, Forecasting Error Slams ServiceNow as Shares Drop 20%" (NYSE: NOW)
How should I present my KPIs?
KPIs are typically organized in the form of a "dashboard", which is analogous to a car dashboard. More often than not, the dashboard is comprised of a series of charts and graphs to help visualize the context. A dashboard should be easy to read, easy to share and comprised of metrics that are bulletproof. Any variance or trend that differs from the expectation should be called out, research, and explained in a commentary section. A dashboard needs to be built in a way that allows for updates to be made with as little human involvement as possible.
How can I get my KPIs faster and still be confident in the accuracy and integrity of the data?
- This is the billion dollar question. We know that inaccurate data can be harmful to the business in many ways. We also know that data begins to lose value the longer it takes to compile and publish creating the necessity for digesting ever-increasing amounts of data in less time.
- One thing a new CFO will often do is implement new systems and controls so that data is being collected properly by all the stakeholders involved. There are countless tools and programs in the market that can help collect data and turn it into easily digested charts and tables; however, this still requires that the root data be input correctly to begin with.
In the end you want it to be simple so that the implications of the data can be understood by all.
"If you can't explain it simply, you don't understand it well enough" - Albert Einstein
Closing Disclaimer
Tracking metrics is a necessity for any business to stay focused throughout the year if the objective is to achieve strategic goals. However, bad data has the ability to do far more damage than no data at all. Akin to bad data is the misinterpretation of data, such as: believing correlation implies causation and the confirmation bias.
The full text is available for registered users. Please register to view the rest of the article.
Related articles

There are many software products that claim to support CPM, but often they only support some...

Corporate Performance Management (CPM) is all about making decisions on the operation of both the business...
+
Subscribe to
FP&A Trends Digest
We will regularly update you on the latest trends and developments in FP&A. Take the opportunity to have articles written by finance thought leaders delivered directly to your inbox; watch compelling webinars; connect with like-minded professionals; and become a part of our global community.