
As I walk around various offices or even in social gatherings, I find many conversations about artificial...

Next Generation Budgeting: More Profitable and Much More
March 4, 2020
 In this article, we will look at how driver-based advanced analytics has overcome the problems with the current budgeting process.
This is the first article in a series that is devoted to next generation budgeting; specifically, the operational income statement (OIS) and its associated operational budget (OB). This article will review the analytics that makes the OIS possible. NOTE: If this analytics is not well-understood, the benefits described in subsequent articles may not be fully appreciated. In fact, the interested reader is urged to contact the author if, for any reason, this first article is not clear.
This article has 3 sections: i) What is OIS; ii) the OIS structure and its associated analytics and iii) Conclusion. It describes how easy it is to demonstrate one of OIS’s most important benefits - more profit. It does so by determining how much profit last year’s p/l left on the table. In fact, an OIS test case demonstrated the firm had left an excess of 50% profit.
What is OIS
OIS is a totally new answer to the major problems with the current budgeting process. These are well summarized in Steve Morlidge’s FP&A Trends article “Why Budget?” Quoting from the article:
- “budgets consume an enormous amount of time and effort for limited business benefit.
- the budget cycle is so long that the results are out of date and therefore useless as soon as the process is finished
- budgets encourage dysfunctional behaviour
- budgets are inflexible, making it difficult to respond to opportunities and threats in the marketplace.”
More offhandedly, the problems with the current budget’s process were summarized nicely by the former GE CEO, Jack Welch. Paraphrasing: ’The budget process should never have existed; it is the bane of corporate America.’
Importantly, OIS is developed first and then the OB from it. Today it’s the opposite; the budget is developed first and then the income statement is developed from it.
Also, OIS is a particular kind of a driver-based model. Specifically, all the drivers are the same; i.e. activities (aka, operations, processes, production lines).
Some of the most important benefits of OIS’s activity-based model are:
- The model’s solution includes a revised forecast and its associated income statement (OIS). Because the solution uses prescriptive techniques, OIS contains the best possible outcome whether for profit, revenue or contribution margin.
- OIS is always up to date. It is updated in real-time when any of its underlying assumptions change importantly; for example, new product slip, change in the forecast, supplier disruption, implications of new tariffs
- The budget process is much simpler with no gaming or “tops down” control
- Finally, OIS moves the budget off its current qualitative, departmental cost basis to one quantitatively driver-based by activities. Since activities are the foundation of Operations, OIS means Financial Planning and Analysis (FP&A) and Sales & Operations Planning (S&OP) now share a common, driver-based financial planning capability, truly next generational.
Thus, OIS confirms that FP&A Trends Group Managing Director, Larysa Melnychuk, was prescient when, in a recent email, she observed: “…S&OP is one side of FP&A.” (NOTE: As references, these WSJ and Forbes financial trade articles provide additional confirmation of OIS’s operational and advanced analytics approaches.)
How OIS is created
The OIS model is created with a node/link structure and is costed with predictive analytics. It is then solved with prescriptive analytics; in this case, a mix of integer and linear math programming techniques is applied. As such, OIS represents leading state 4 and 5 analytics in London’s FP&A Board’s analytics maturity model. See Figure 1, below.
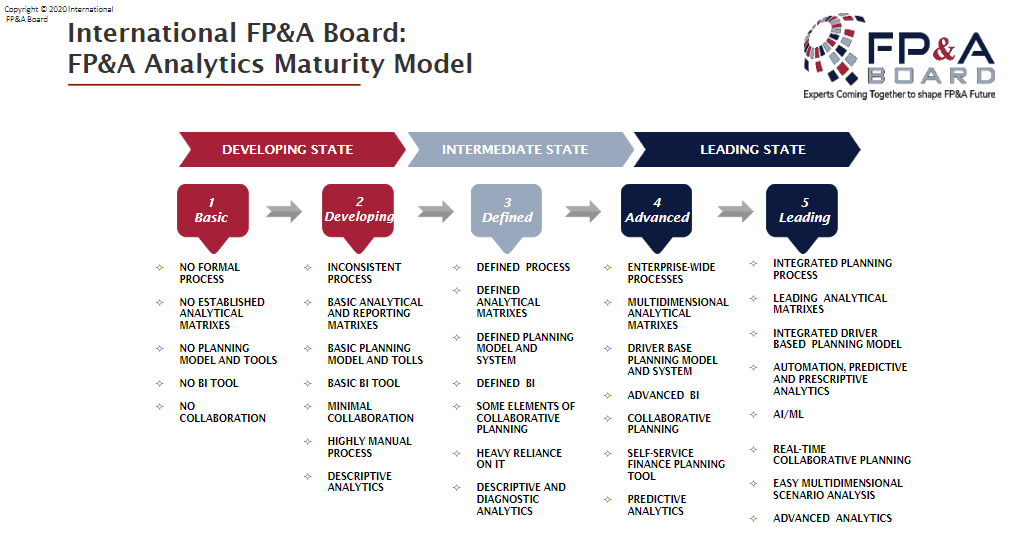
Figure 1. FP&A Analytics Maturity Model
Each term in this definition will be discussed in turn.
- Node/link structure: See Figure 2, below for a schematic of this structure.
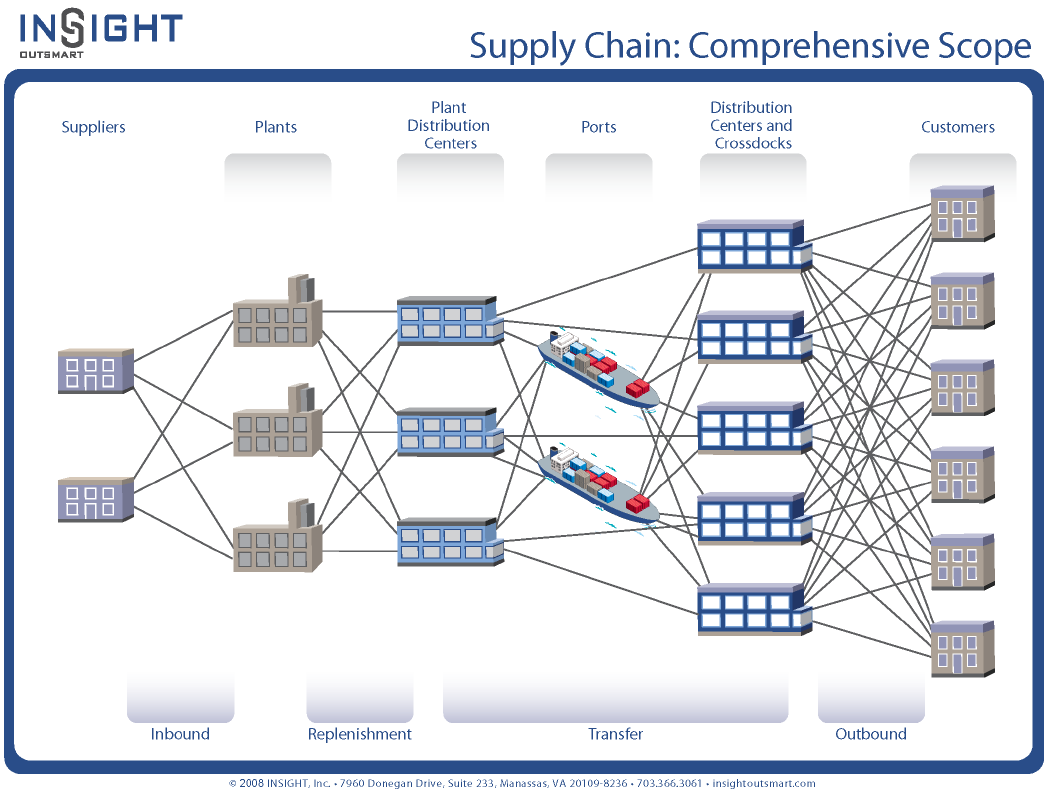
Figure 2. Supply chain
The nodes are facilities and are connected by links. Inside the facilities are activities (aka, processes, production lines) and products.
All four of these structural elements (i.e., links, facilities, activities and products) are capacitated and, where possible, one or more capacity relief alternatives are included in the model. For example, build ahead, overtime, outsourcing, second shift, additional capital equipment, etc.
- Predictive analytics: There are two kinds of predictive analytics (i.e., cost functions and response function) used by OIS to cost the elements of the income statement. The first one is used for COGS and G&A and is called cost functions. They describe how the linear and fixed costs of each of the facilities, activities, products and links vary by quantity. See Figure 3 below.

Figure 3. Cost functions
The relationship between facility, activity/production line and product cost functions are modeled with a cost function tree structure. See Figure 4, below
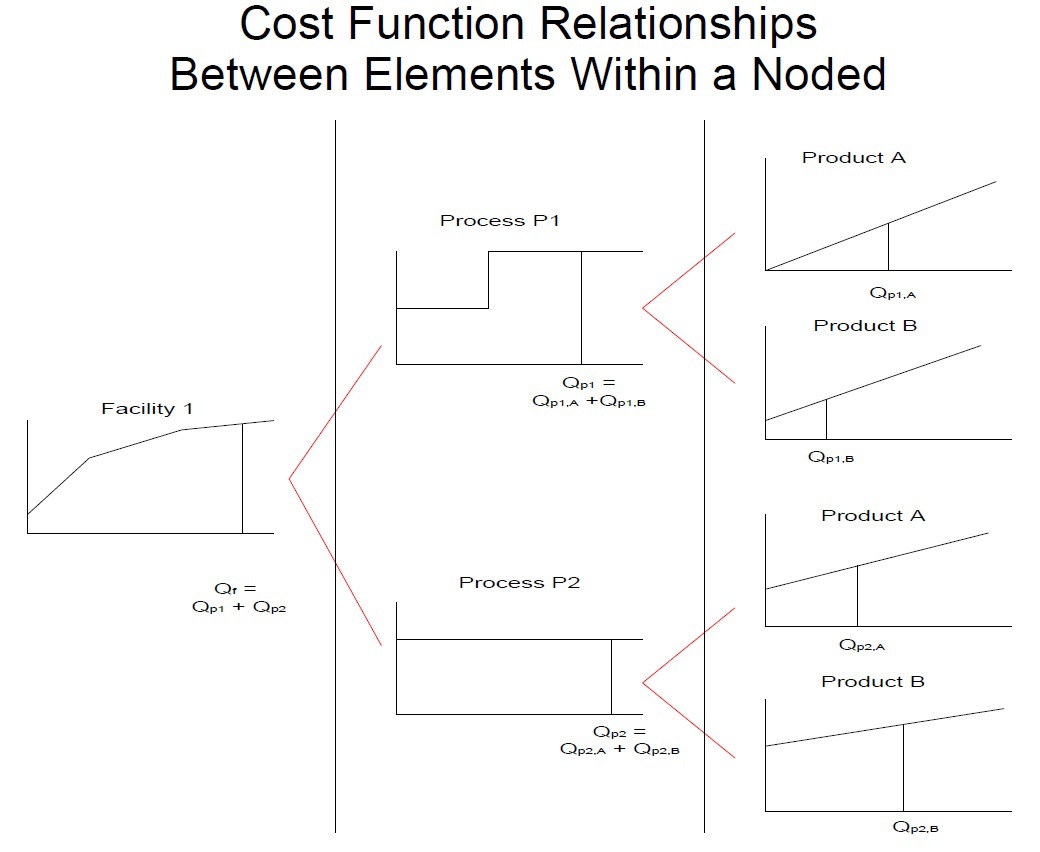
Figure 4. Cost function tree structure
Second, response functions describe how quantity varies as a function of total sales and marketing fixed and variable costs (i.e., the S of SG&A). See Figure 5 below.
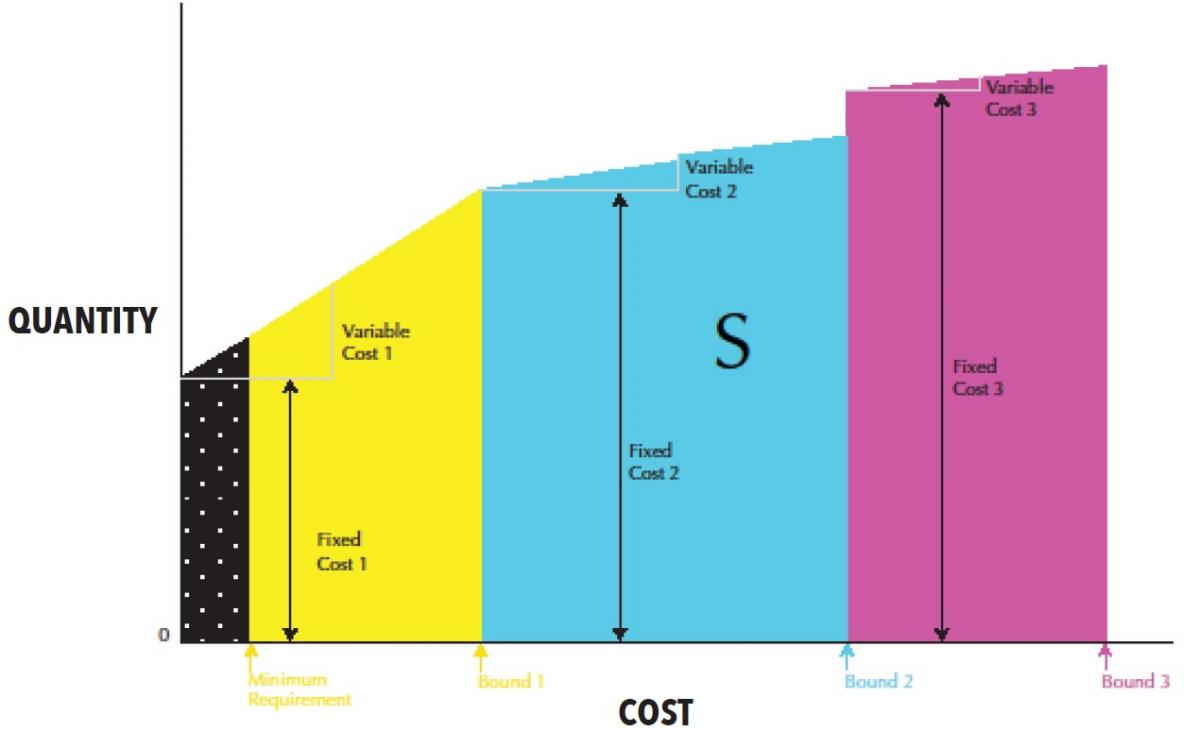
Figure 5. Response functions
Prescriptive analytics: The prescriptive technique used by OIS is a mixture of integer and linear math programming techniques (MILP). While the specifics of the techniques are beyond the scope of this article, other examples of MILP applications were cited above and include supply chain network design and marketing mix modeling. These have been commercially successful for decades.
There are two reasons why the OIS model cannot be solved by scenario analysis; i.e., by enumerating the possible solutions:
- Combinatorial complexity: One of the most important decisions made in prescriptive modeling is whether a given element (e.g., facility, activity, product and link) is in or out of the solution. In even a modest, real-world supply chain, there are hundreds and hundreds of such elements. Even just 50 such binary choices create 10 to the 16th possible solutions. That’s more than one-half of all the atoms in the universe.
- Capacity complexity: For those hundreds and hundreds of elements, most have existing capacity limits. Further, for many, capacity relief is available, frequently with more than one option as described above.
The results of the OIS model include:
- A new forecast with the best possible profit
- A monthly production plan which includes making Q amount of product P for activity/production line A in plant PL during time period T, months in this case. Results cover all products for all activities at all plants for all time periods including all associated costs.
- Given the model’s parameters, all the activities/production lines and plants for all time periods are appropriately capacitated. This ensures the necessary resources and capacities are in place to make and fulfill the new forecast. Also, included are, as appropriate, constraints on customer service, raw material suppliers, DC locations (throughput and inventory) and energy or carbon implications.
How an OB is created
As illustrated in Figure 4, all fixed costs associated with variable costs are included in OIS. Thus, all that’s required to create an OB is to add those costs that are completely fixed; e.g., elements of R&D, elements of corporate headquarters, etc. NOTE: These completely fixed costs have no impact on the OIS results.
Conclusion
Given the promise of next generation budgeting, it is important to know how easily the OB’s value proposition for any given firm can very be determined. Specifically, how much profit did last year’s p/l leave on the table?
The first step in creating an OIS is to create a baseline model of last year's p/l results. This baseline model ensures the OIS model has structural integrity, typically modeling last year’s results to within 1-2%.
Then, all that's required are the following three steps to update the baseline model:
1. Response functions added to the model
2. Where possible, all constraints must be relaxed since there is no way of determining what the new forecast’s volumes will be. Further, when there is more than one option (e.g., second shift, outsource, build ahead, over time), they all should be included so the best one can be chosen. Example of the constraints include:
- Procurement availability limits
- Manufacturing capacity limits
- Distribution Center throughput limits
- Storage limits
- Inventory targets
- Customer service limits
- Other transportation link restrictions
- Energy consumption limits
- Carbon emission limits
3. Updated baseline model is configured, creating the new, superior income statement. It includes the new forecast and the associated supply chain required to make and fulfill it. The difference between the profit of the new income statement and last year’s actual profit is the profit that was left on the table. It serves as a compelling "proof of concept" of the OIS’s value proposition.
The full text is available for registered users. Please register to view the rest of the article.
+
Subscribe to
FP&A Trends Digest
We will regularly update you on the latest trends and developments in FP&A. Take the opportunity to have articles written by finance thought leaders delivered directly to your inbox; watch compelling webinars; connect with like-minded professionals; and become a part of our global community.