
The corporate planning process is a controversial subject on which opinions differ widely. But experience has...

Understanding Value Is a Calculated Business!
September 17, 2019
 There are different financial indicators to monitor the financial results of a company. Focussing on ‘value creation’ is sometimes considered ‘rocket science’ for the local management team. However, by explaining the steps of calculating ‘value’, management will quickly see what is meant by it and how they create it.
The following ‘value’ model was used to manage business units across several continents; a practical case of Value-Based Management. Based on a manufacturing company, it provides basic insights into how value creation can be reported, moving away from the more traditional P&L.
A. Cash Value
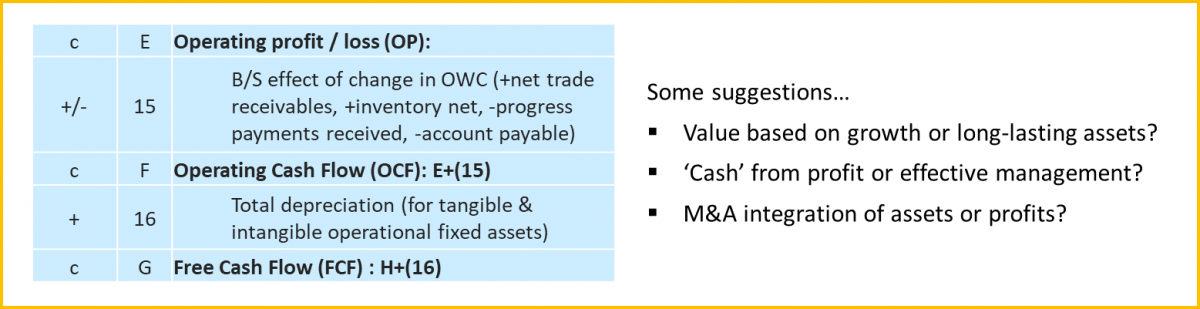
Today, it is all about generating cash. Free Cash Flow (FCF) is often seen as the ‘holy grail’. It shows the cash available to the owners (or shareholders), free from any other obligation. It excludes counting for depreciation because it isn’t a cash payment, only an allocation of costs over the lifetime of fixed assets.
The way the business operates, pays its bills and charges its clients, also influences how much cash is stuck daily operations or available for the owners. These ‘cash flows’ from operations move through the balance sheet (B/S). The Operating Cash Flow (OCF) shows how much ‘cash’ is added to or lost from the Operating Profit (OP).
The Free Cash Flow is commonly used in valuation models. Management reports sometimes show the FCF of a business but call it OCF. The more FCF is generated, the higher the value of the company.
B. Operational Value
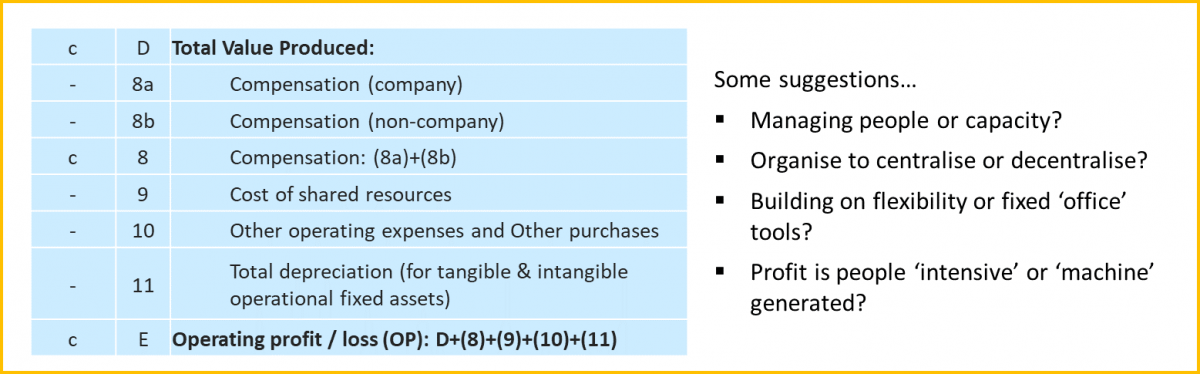
Operating Profit (OP) is the standard to evaluate the financial performance of a business. Every executive understands this concept. From a value point of view, you can distinguish between what ‘machines’ produce in value and what ‘people’ add to the business.
People need compensation, which either goes through the payroll, or as temps supporting the organisation. In addition, outsourcing support processes shows how much a business is being facilitated by (centralised) activities. This is the core of what is minimally needed to be in business.
Of course, employees also receive (social) benefits, which differ in each country, and there are the expenses to get the products sold, different for each product/market. The cost of the fixed assets is also accounted for, since without it there wouldn’t even be a business.
C. Production Value
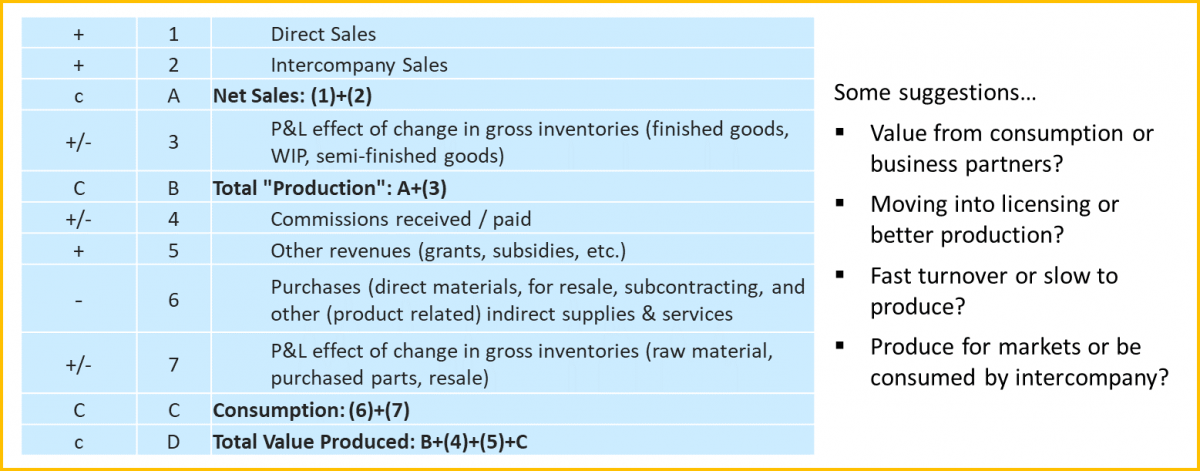
If people are one part of the value equation, ‘machines’ are on the other. Machines ‘consume’ all types of resources. An international manufacturer commonly will have e.g. products being resold through ‘his’ BU, commissions, licencing products or parts, outsourced activities.
From the production process itself, there is also the P&L effect of the inventory. One part relates to what is being consumed in the production to create a product of value, and one part is about ‘goods’ which already have their value produced but weren’t sold/delivered. This makes how much was ‘sold’ according to the books, and how much of production was really ‘delivered’, very tricky.
Any business has to adapt to disruptions or a 4th industrial revolution (4IR). It will be common to have multiple income streams and produce for various business models. This makes “Production” and cost management vital in creating value.
D. Value by Design…
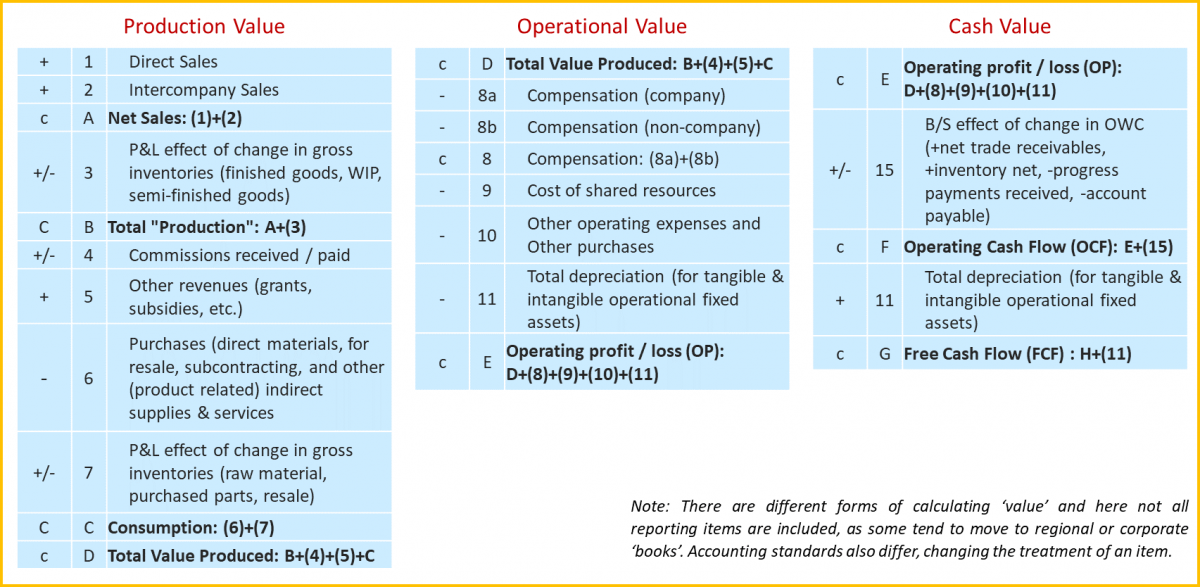
Creating value requires working with other financial KPI´s, and not the standard gross and net profit margin analyses. To compare a production plant, market segment, or BU’s, with its peers becomes transparent for financials and non-financials, when using a ‘value model’. Getting to the roots of the cash flow, will end short-term thinking and initiate a planned design. Management can add their story to the numbers, especially when explaining Rolling Forecast deviations or presenting (Beyond Budgeting) investment opportunities. This is using ‘value’ to design and drive the business!
The article was first published in Unit 4 Prevero Blog
The full text is available for registered users. Please register to view the rest of the article.
Related articles

The article is titled Mergers & Executions. It’s not a typo. You might think it should...

The dusk of Management Taylorism is the dawn for the strategic CxO. Constant cooperation, communication and...

To create value from data, you do need a big data strategy – right? Well, actually...
+
Subscribe to
FP&A Trends Digest
We will regularly update you on the latest trends and developments in FP&A. Take the opportunity to have articles written by finance thought leaders delivered directly to your inbox; watch compelling webinars; connect with like-minded professionals; and become a part of our global community.