 The central CPM business model requires multi-dimensional technology. Whether this is an OLAP or ROLAP database is irrelevant, however, the members that make up each dimension will need to be assigned ‘attributes’ that will allow them to be reported and analyzed in ways other than their physical structure / hierarchy within the model.
The CPM business model will typically consist of the following 7 dimensions:
1. Measures
This is a traditional dimension containing the measures used throughout the application. Attributes should be assigned to each measure that denotes what the measure represents. This could include:
-
Resource attribute is for those measures consumed by an activity (e.g. travel expenses. This could also include people time)
-
Success attribute is for KPI’s that denote the success of an activity (e.g. the success of the marketing programs may be the metric “number of leads”)
-
Implementation attribute is for measures that denote the status of an activity (e.g. The implementation of a marketing program could be measured by the number of mailings made to the target market.) Later on, these attributes can be used to define reports that show all measures designated as ‘Resource’ or ‘Success’.
2. Organisation
This dimension contains the departments and how they consolidate into the total company. Given that hierarchies change over time, it’s important that these changes are tracked and are made available for reporting purposes.
3. Activity
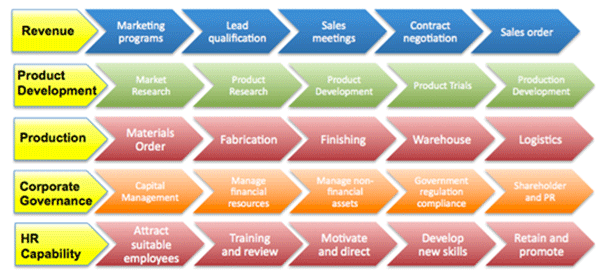
This dimension is used to identify organisational activities and the relationship between them that lead to organisational objectives. E.g. how revenue/income is generated; how products/services are manufactured, etc. Note that this is not a strategy map, which is typically used to show how improvements can be made to a business model. Activities within this dimension should show ‘business as usual’ and denotes how the organisation currently operates. Some activities will have a one-on-one relationship with the organisation structure, while others will go across multiple departments. The members of this dimension should be organised as a hierarchy.

4. Strategy
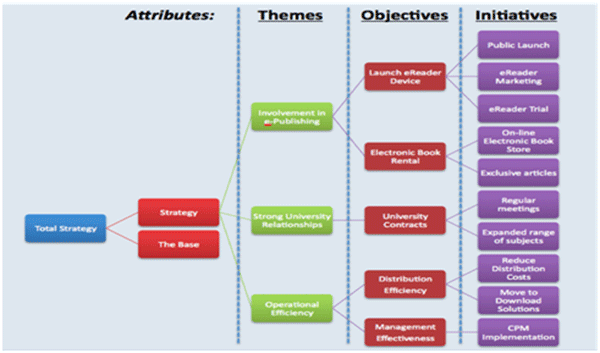
This dimension is used to hold the resources and relevant KPIs assigned to initiatives. It effectively turns the CPM business model into a combined business/strategy model. The members form a hierarchy synonymous with a strategy map. The different levels can represent the methodology being used – for example, the Balanced Scorecard calls these levels ‘Themes’, ‘Objectives’, and ‘Initiatives’.
For this dimension to cope with those parts of the plan not covered by an initiative, which still need to aggregate with initiative data to give a total company position, the following structure can be used:
On each initiative, it’s important to record its effective date and the people responsible for its implementation. Non- strategy information, e.g. overheads, are assigned to ‘The Base’ member. ‘Total Strategy’ will contain the aggregation of both ‘strategy’ and ‘the base’ members.
5. Time
This defines the years and periods to be covered by the model. Some data may be held at a day level and so these should be accumulated as appropriate
6. Version
This is used to separate actual, budget and forecast versions of data held by the model. It should also have members to hold benchmark data such as market and competitor statistics.
7. Other Dimensions
Other dimensions may be required to collect things such as sales by product group, customer type, etc.
It is the intersection of these dimensions that identifies the resources to be applied, by which departments, in order to deliver a particular activity. These resources are shown by time and can be separated into different versions such as budget, forecast and actual.
By using a multi-dimensional model, those same resources can be consolidated by both activity group and organisational unit, to give a total company position.
A similar intersection with different measures (as selected by their attribute) can be used to monitor the implementation of those activities and the success those activities are achieving.

Subscribe to
FP&A Trends Digest

We will regularly update you on the latest trends and developments in FP&A. Take the opportunity to have articles written by finance thought leaders delivered directly to your inbox; watch compelling webinars; connect with like-minded professionals; and become a part of our global community.

