
Dashboards have become a powerful tool for FP&A to share insight and gain respect. In this...

Create Eye-Catching Monthly FP&A Reporting Packages
May 24, 2018
By Linda A. MacDonald, Controller and Finance Manager at Quadrant Health Strategies, Inc.
 FP&A professionals know that in internal finance, your “customers” are senior management, stakeholders and business leaders.
As a finance business partner, whether a Director of FP&A, Finance Manager, Financial Planning Analyst, or Controller, you are the “SME” (subject matter expert), and monthly reporting is your time to shine.
THE FINANCE SME
As a trusted finance business partner, you are the person involved in the day-to-day details of the business, closest to the transactions, making sense of data sets, compiling information, making decisions surrounding revenue recognition and expense management in accordance with US GAAP. You are heavily relied upon from your customers, the business leaders, to present accurate, transparent, timely and informative management reports, financial statements, metrics, KPIs, graphs and other visual representations of data that are relevant, pertinent and reliable. The purpose of these reports is for leaders to make sound business decisions that ultimately provide direction for the longevity of the business. A lot rests on your shoulders!
THE NEW NORMAL
In my experience, whether your business leaders are financially savvy or not, solely presenting management reports, financial statements and long lists of generic information in a monthly reporting package has been proven ineffectual. Management reports and financial statements must be accompanied by visual aids, narratives and commentaries for optimal impact.
First, learn what your business leaders are most interested in. Does their eye drop right to the bottom of the P&L to total net income or loss? Are they most concerned with gross margin or contribution margin? The goal is to summarize data in easy-to-understand formats that show relevant information that prompts business leaders to put strategies in place to improve results and ultimately stakeholder value.
GOING A STEP FURTHER
In your monthly reporting package, consider incorporating analysis such as what-if analysis, rather than the run-of-the-mill reporting expectations. Since management reports are submitted in electronic format, be sure to lock spreadsheets and cells. You can create “input cells” if you want to create an interactive or results-driven report that is dependent on certain criteria and variables.
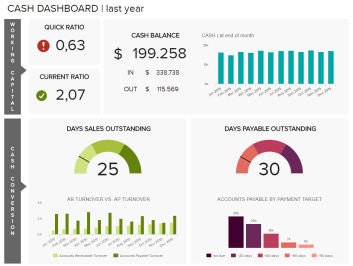
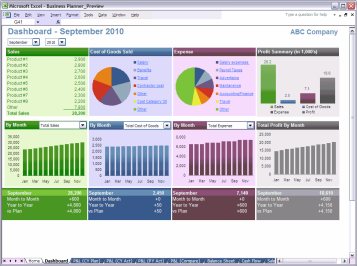
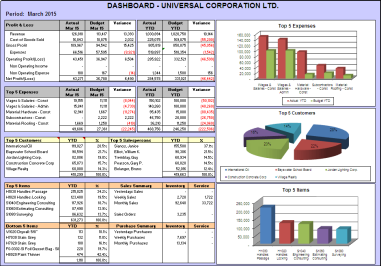
INFOGRAPHICS AND DASHBOARDS
There are a number of business intelligent programs that will automatically generate dashboards or you can use Excel to create attractive and eye-catching graphics that display results. Bar charts, pie charts, and linear graphs can be designed to visually emphasize trends and results that are comprehensive, memorable and impactful. Data dashboards manage your metrics and KPIs in one snapshot. Coloring graphs should be done in one tone or theme variation and should use no more than three to four shades of the same color. You can even pull your company’s brand colors into your presentation.
When creating charts and graphs, remember that simpler is better. Simplify graphs and charts by removing unnecessary axes and background lines. Remove redundant labels and legends. Clear, concise charts, graphs and infographics can provide a comprehensive overview of the business’s financial picture. Use business metrics to gauge performance or progress toward a quantifiable goal. Use KPIs to provide critical insight into “key” business measurements that best convey your business’s story.
When management reports are insightful, explanatory and convey a meaningful message, they are highly anticipated and referred to by senior management and business leaders throughout the month. Be sure to give yourself kudos by incorporating your name into the presentation, so your name is seen regularly by senior management.
SELECTING THE RIGHT CHART OR GRAPH FOR YOUR DATA
There are 4 main types of charts and graphs:
- Comparative
- Relational
- Distribution
- Composition
Line graphs compare changes over the same period of time.
Pie charts compare relationships of parts of a whole or highlight proportions.
Bar graphs compare data between different groups or track changes over time.
Stacked column shows the parts that contribute to the total and compare change over time.
COMMENTARIES AND NARRATIVES
Each financial ratio presented as a result of your in-depth financial analysis, whether profitability, efficiency, stability, liquidity, debt or investor ratios, should include an explanation. For example, if including a quick ratio of 1.5, you want to provide a narrative that says something like, “This ratio gauges liquidity, meaning the business has $1.50 of liquid assets available to cover each $1.00 of current liabilities.” By simply stating, in a few words, what the ratio is measuring and what it means, supports business leaders’ understanding and purpose for the measurement. The additional narrative provides valuable information for business leaders to make informed decisions.
MAKING RECOMMENDATIONS
As an FP&A professional, you should also make recommendations for improvement and provide solutions. For example, when supplying a profitability ratio such as a contribution margin, which measures a business unit’s or product’s portion of net revenue that contributes to the company’s profit, you want to suggest specific strategies for improvement. Provide a commentary such as, “At this time, a review of the current pricing structure or reducing variable production costs may be required.” This recommendation further provides an overall comprehensive picture to senior management on how to best move forward with decisions.
The FP&A professional’s part in leadership is vital and important to the decision-making process and direction of your business. Make it your mission to provide the most relevant data to your “customers.” Explain in non-finance terms, the results, implications, and impact of decisions. This is your area to own, so be cool, calm and collected, and communicate with confidence!
The full text is available for registered users. Please register to view the rest of the article.
Related articles

Well-designed incentive compensation plans – especially sales commission plans – are an incredibly powerful way to...

You will be considered a great FP&A professional only if you can communicate clearly, effectively, and...
+
Subscribe to
FP&A Trends Digest
We will regularly update you on the latest trends and developments in FP&A. Take the opportunity to have articles written by finance thought leaders delivered directly to your inbox; watch compelling webinars; connect with like-minded professionals; and become a part of our global community.