Home
The Online Resource for Modern FP&A Professionals
Please register to receive the latest FP&A news, updates and tips Login

Main menu

  • Home
  • FP&A Insights
    • FP&A Trends Digest
    • FP&A Trends Research
    • FP&A Trends Insight Paper
    • FP&A Trends Survey
    • Short Videos
    • Our Contributors
  • FP&A Events
    • International FP&A Board
    • FP&A Trends Webinars
    • Digital FP&A Circles
  • AI/ML Committee
    • Introduction
    • Members
    • Resources
    • Meetings
  • FP&A Tools
    • FP&A Trends Maturity Model
  • About Us
    • Company Policy
    • Privacy Policy
    • Editorial Guidelines
    • Our Ambassadors
    • Our Sponsors & Partners
    • Contact Us
image
The Most Useful Graph Ever
March 13, 2018

By Randall Bolten, longtime Silicon Valley CFO, author of "Painting with Numbers: Presenting Financials and Other Numbers So People Will Understand You,” and adjunct professor at U.C. Berkeley Extension​

RANDALL BOLTEN grew up in Washington, D.C., the son of a CIA intelligence officer and a history professor. He is passionate about the importance of presenting financials and other numerical information in a cogent and effective way, and in his current life is the author of Painting with Numbers: Presenting Financials and Other Numbers So People Will Understand You (John Wiley & Sons, 2012).

He is a seasoned financial executive, with many years directing the financial and other operations of high-technology companies. His experience includes nearly twenty years as a chief financial officer of software companies.

He has held the CFO position at public companies BroadVision and Phoenix Technologies, and at private companies including Arcot Systems, BioCAD, and Teknekron. Before his CFO positions, he held senior financial management positions at Oracle and Tandem Computers.

He received his AB from Princeton University, headed west to earn an MBA at Stanford University, and ended up staying in Silicon Valley. 

In addition to writing Painting with Numbers, he currently operates Lucidity, a consulting and executive coaching practice focused on organizing and presenting complex financial information. He divides his work time between Glenbrook, NV and Washington, DC, and maintains an office in Menlo Park, CA.

FP&A Tags
Data Visualisation
FP&A Storytelling

Well-designed incentive compensation plans – especially sales commission plans – are an incredibly powerful way to motivate great performance. But designing a great plan is both an art and a science, and prone to design mistakes that are expensive and end up not motivating the desired performance. The commonest and most serious error plan designers make is to lay out the rules before deciding just what it is the enterprise is trying to accomplish. You can avoid that mistake with a simple, straightforward graph that I’ve drawn hundreds of times in my career. Follow these steps:

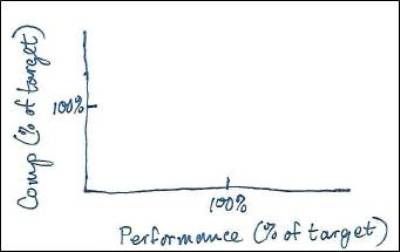
1. Draw your axes. “Performance” goes on the X-axis (i.e., the horizontal axis) and “Compensation” goes on the Y-axis (i.e., the vertical axis). For now, you don’t have to graph actual dollar amounts… just think in terms of percentage of target amounts:

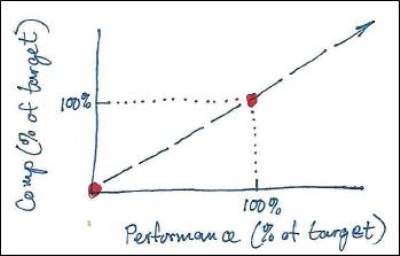
2. Plot the obvious points. Those would be 0% of target comp at 0% of target performance and 100% of comp at 100% performance. You might also find it useful to draw a reference line through those two points. (That reference line happens to be the graph for a plan with a commission rate that is constant across all levels of performance.)

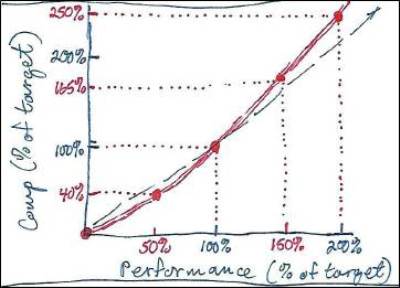
3. Plot some additional points and connect those points with straight lines or curves. Work with line managers and senior managers to get a sense of how much incentive comp they believe is appropriate at specific levels of performance. For example, here’s a graph for an “accelerated” sales commission plan – that is, one where above-quota performance is rewarded with increasing commission rates, and below-quota performance is penalized, where management has specifically suggested compensation of 40%, 165%, and 250% of target comp for performance at 50%, 150%, and 200% of target, respectively. Note that the compensation curve sits below the reference line for performance below 100% of target, and above the reference line for performance above 100% of target:

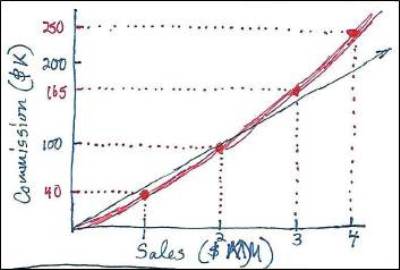
4. Plot the same graph, but this time with actual performance levels and comp amounts.  Here’s what the graph might look like for the accelerated plan described above, where “Performance” is Sales, with a quota of $2,000,000, and target commission is $100,000:

You’re now ready to flesh out the comp plan with spreadsheets and other formal documentation.

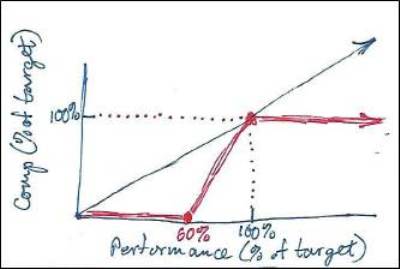
Just for comparison, here’s another example, this time for a typical management MBO plan where no bonus is earned until a specific performance level, such as 60%, is met, and the maximum bonus is the target MBO amount:

In this way, you can visualize any approach to incentive comp, form conclusions about whether that’s the approach you want, and then fill in the blanks to design a comp plan that actually does what you intended. 

Sometimes a picture IS worth 1,000 words. 

RANDALL BOLTEN grew up in Washington, D.C., the son of a CIA intelligence officer and a history professor. He is passionate about the importance of presenting financials and other numerical information in a cogent and effective way, and in his current life is the author of Painting with Numbers: Presenting Financials and Other Numbers So People Will Understand You (John Wiley & Sons, 2012).

He is a seasoned financial executive, with many years directing the financial and other operations of high-technology companies. His experience includes nearly twenty years as a chief financial officer of software companies.

He has held the CFO position at public companies BroadVision and Phoenix Technologies, and at private companies including Arcot Systems, BioCAD, and Teknekron. Before his CFO positions, he held senior financial management positions at Oracle and Tandem Computers.

He received his AB from Princeton University, headed west to earn an MBA at Stanford University, and ended up staying in Silicon Valley. 

In addition to writing Painting with Numbers, he currently operates Lucidity, a consulting and executive coaching practice focused on organizing and presenting complex financial information. He divides his work time between Glenbrook, NV and Washington, DC, and maintains an office in Menlo Park, CA.

The full text is available for registered users. Please register to view the rest of the article.
  • Log In
  • or
  • Register

Related articles

The Top Three Recommendations for Mastering FP&A Dashboards
May 29, 2018

Dashboards have become a powerful tool for FP&A to share insight and gain respect.  In this...

Read more
The Most Useless Visualisation Ever
December 16, 2017

Let’s take a look at some of the most messed-up, incomprehensible recent examples of quantation. Not...

Read more
Visual FP&A: Is Graphing the Right Choice?
October 7, 2017

In my last article, I listed four questions you should ask yourself, and the order you...

Read more
+

Subscribe to
FP&A Trends Digest

We will regularly update you on the latest trends and developments in FP&A. Take the opportunity to have articles written by finance thought leaders delivered directly to your inbox; watch compelling webinars; connect with like-minded professionals; and become a part of our global community.

Create new account

image

Event Calendar

Pagination

  • Previous
  • May 2025
  • Next
Su Mo Tu We Th Fr Sa
27
28
29
30
1
2
3


4
5
6
7
8
9
10
11
12
13
14
15
16
17
Transforming FP&A Together: Human & AI Synergy
 
18
19
20
21
22
23
24
Moving from FP&A to Extended Planning and Analysis (xP&A)
 
Five Critical Roles for Building a World-Class FP&A Team
 
25
26
27
28
29
30
31
FP&A Business Partnering and AI: A New Era
 
All events for the year

Future Meetings

The Face-to-Face Amsterdam FP&A Board
The Face-to-Face Amsterdam FP&A Board Transforming FP&A Together: Human & AI Synergy

May 15, 2025

The Face-to-Face Milan FP&A Board
The Face-to-Face Milan FP&A Board Moving from FP&A to Extended Planning and Analysis (xP&A)

May 20, 2025

The Face-to-Face Frankfurt FP&A Board
The Face-to-Face Frankfurt FP&A Board Five Critical Roles for Building a World-Class FP&A Team

May 22, 2025

BPAI
The FP&A Trends Webinar FP&A Business Partnering and AI: A New Era

May 28, 2025

The Face-to-Face London FP&A Board: Data Management & Analytics: Unlocking FP&A Value
The Face-to-Face London FP&A Board Mastering Data in FP&A: Smarter Analytics, Better Decisions

June 5, 2025

FP&A Trends Webinar The Evolving Role of FP&A: From Number Cruncher to Strategic Advisor
The FP&A Trends Webinar Making FP&A Teams Fit for the Future

June 11, 2025

The Face-to-Face New York FP&A Board
The Face-to-Face New York FP&A Board From Insight to Impact: FP&A Business Partnering in Action

June 17, 2025

The Face-to-Face Sydney FP&A Board
The Face-to-Face Sydney FP&A Board Modern Financial Planning and Analysis (FP&A): Latest Trends and Developments

June 26, 2025

The Face-to-Face Singapore FP&A Board: Modern Financial Planning and Analysis (FP&A): Latest Trends and Developments
The Face-to-Face Singapore FP&A Board Modern Financial Planning and Analysis (FP&A): Latest Trends and Developments

July 8, 2025

AI/ML FP&A
AI/ML FP&A
Data and Analytics
Data & Analytics
FP&A Case Studies
FP&A Case Studies
FP&A Research
FP&A Research
General
General
Integrated FP&A
Integrated FP&A
People and Culture
People and Culture
Process
Process
Technology
Technology

Please register to receive the latest FP&A news, updates and tips.

info@fpa-trends.com​


Foot menu

  • FP&A Insights
  • FP&A Board
  • FP&A Videos

Footer countries

  • Amsterdam
  • Austin
  • Boston
  • Brisbane
  • Brussels
  • Chicago
  • Copenhagen
  • Dubai
  • Frankfurt
  • Geneva
  • Helsinki
  • Hong Kong
  • Houston
  • Kuala Lumpur
  • London Board
  • London (Circle)
  • Melbourne
  • Miami
  • Milan
  • Munich
  • New York
  • Paris
  • Perth
  • Riyadh
  • San Francisco
  • Seattle
  • Shanghai
  • Singapore
  • Stockholm
  • Sydney
  • Tokyo
  • Toronto
  • Washington D.C.
  • Zurich

Copyright © 2025 fpa-trends.com. All rights reserved.

0