
The Logical Thinking Process was originally developed by Dr. Eliyahu M. Goldratt, author of bestselling business...

From Symptoms to Cause: How to Identify Faulty KPIs
January 3, 2020
 Setting targets and defining KPIs is one of the key tasks of FP&A professionals. Defining KPIs is tricky. When properly done they can really drive performance, but sometimes it is the other way around. We see this in the following practical example of the application of the Logical Thinking Process methodology for problem solving. The example is taken from my new book, From Symptoms to Causes, which will be published early this year.
In this fictional example we work our way from a goal, through problem analysis, conflict analysis and towards a solution. The organization is a specialized hospital. The goal of our hospital is to be the best heart surgery hospital in the region. In order to achieve this, they must hire the best people, have all the necessary equipment and minimize waiting time. We see the Goal Tree below.
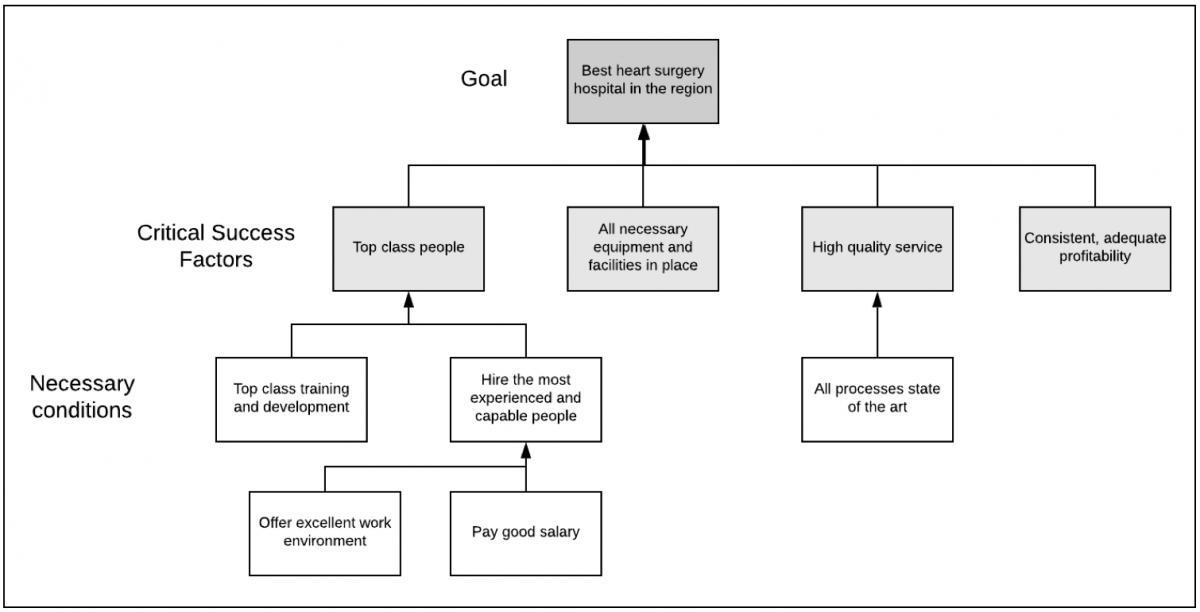
Diagram 1: Goal Tree for a hospital
But in reality, things are not this good. The best people are leaving, financial results are getting worse and the quality of the service deteriorating. In the Current Reality Tree below we see the analysis of what causes those problems. At the root of is a single KPI; salary per person. A seemingly perfectly harmless performance measure that in many systems might be fine to use. But in this system and this situation, it really drives down the performance.
We also see two negative reinforcing loops (vicious cycles): The need to constantly hire new people drives up the payroll and then drives down salaries (loop A), which again drives the flight of experienced people, leading to more hiring. The high failure rate then further reinforces the reluctance of experienced people to work for the hospital, which again drives the high failure rate (loop B).
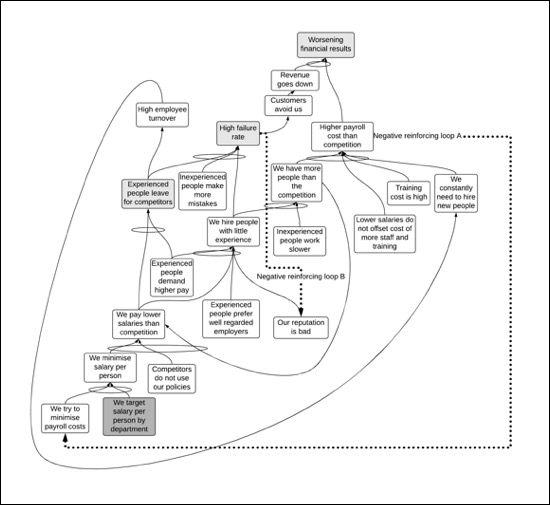
Diagram 2: Current Reality Tree surfacing a critical root cause
The problem with KPIs is that if used incorrectly they can cause sub-optimal performance. The reason is that many KPIs measure only results for one part of the system, ignoring the effect on the system as a whole. Salary per person measures the payroll cost only. It does not indicate the performance of the hospital at all, and even more importantly, it does not indicate the value provided by different employees. It is an overly simplistic measure and when taken as an important KPI it leads to the results we have seen.
But there is an important reason we use KPIs: Running a business is to a large extent about staying in control. Keep tab on costs and revenues and being ready to take action when needed. And for a hospital payroll is a large portion of the costs. This is why we must keep it under control and hence we use the KPI of salary per person.
Now, let's imagine we are consultants working for the hospital. We show our analysis to the CEO. What is her likely reaction? Will she jump with joy and agree to throw out the problem KPI? Well, in the unlikely event she does, the CFO sure will not. He will start by asking how on earth are we then going to keep control of payroll. And chances are no-one will have an answer for that, at least not right away.
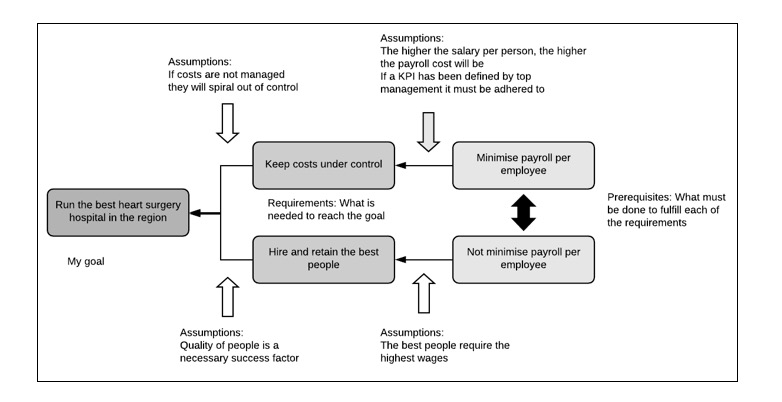
Diagram 3: Unless we solve the conflict, we will not reach our goal
This is a classic example of a conflict; We feel we must do A, while at the same time we also feel we should avoid doing A by all means. And very often this is the end of the matter. We just live with the conflict, we keep doing things in the same old ways. In this case, perhaps we just try to do some more marketing, we add some perks for employees that are cheap for us but important to them (we imagine). Perhaps we start a corporate responsibility program to try to lure people who are intrigued by such efforts. Something of the kind. But attacking the core problem? No, usually not. And why? Perhaps because we don't have the proper tools to really formulate and solve the underlying conflict.
Now, let's structure the conflict. We start with the goal. The goal is to be the best heart surgery hospital in the region. This is already stated. Then we formulate the opposing ends of the conflict: 1. We must base our decisions on salary per person. 2. We must not base our decisions on salary per person. Finally, we formulate the requirements by asking a simple question: Why? Why do we need a salary per person? We need it in order to keep the salary cost under control. And why should we not? We should not because in order to reach the goal we must hire top class people, and everyone knows top class people cost money. Driving down salary per person more and more, will surely not attract them.
The next step is to analyze the assumptions behind the logical connections. In this case, since we have already seen the negative effects from the KPI we must focus our efforts on trying to find logical flaws in the link between the prerequisite of salary per person and the requirement of keeping costs under control. What are the assumptions here?
First, we assume we must manage costs to retain control. In essence, this is true even if the methods of doing this may vary. However, this is not necessarily the only way to reach the goal. Let's say for example that we can gain a competitive advantage that allows us to charge considerably more than the competition, and/or that our processes are so good that we get a lot more utilization of resources than they do. In that case driving down costs will not be all that important. Second, we assume top class people are needed to run a top-class hospital. This is in fact a necessary condition we have already identified. So, the relationship between the goal and this requirement looks pretty sound. The relationship to the first requirement is more shaky.
What then about the prerequisites? We know that in general, the more valuable the employee is the higher the salary they will demand. Of course, there will be other factors that affect people's choice of employer, but the salary is an important one and the correlation is positive. So, we already know now that we should not strive for the lowest salaries for all our people because it may go against our goal. How about the other assumptions? We assume that payroll is a big part of our costs. We assume that the higher the average salary, the higher the payroll cost will be. Finally, we assume that once a KPI has been defined it must be adhered to.
Are all those assumptions valid? Let's have a look: Payroll is a big part of our costs. This is something we simply know. But does this necessarily mean we must manage by average salary per person? No, it does not. Even if we agree we have to keep tab on payroll the average salary is not the only way to do that. So, this assumption is not valid. Should we manage by a KPI simply because it is required by top management? In this case, if we want to reach the goal, we should not. So, this assumption is invalid also. What about the third? Is salary per person the only way to keep a tab on the payroll? Now, salaries differ between people. We might, for example, decide to pay top physicians critical for our operations a higher salary than our competitors are willing to do, while keeping the salaries down for the lower-skilled employees that add less value. Overall this might still drive up payroll per person, but since we are maximizing value-added it simply does not matter. And finally, it really the total payroll we should focus on, not the average. The average is only part of the equation, the other part is the number of people of course. In other words, the rough average KPI we have been using is dead wrong, since it does not measure what matters for us to reach our goal. We have to find a different KPI for the payroll if we really have to have one for it at all.
The full text is available for registered users. Please register to view the rest of the article.
Related articles
+
Subscribe to
FP&A Trends Digest
We will regularly update you on the latest trends and developments in FP&A. Take the opportunity to have articles written by finance thought leaders delivered directly to your inbox; watch compelling webinars; connect with like-minded professionals; and become a part of our global community.