
 Financial Planning & Analysis (FP&A) is gaining more and more attention from business leaders. Its focus is the future of the business. It uses past and actual (big) data to effectively model or support the decision-making, and can timely impact the business focus. The FP&A professionals who work as Finance Business Partners understand basic accounting and reporting, yet their strength is in being from different ‘walks of life’.
FP&A Trends led by Larysa Melnychuk is promoting FP&A worldwide. Their partners/sponsors, PageExecutive (or here), FP&A/Association for Financial Professionals (or here) and CCH Tagetik (or here) are actively participating during presentations, which is rare but great. It demonstrates their commitment with business leaders to create a pool of knowledge and establish a network of professionals adding value to the business.
In Amsterdam, FP&A Trends and partners/sponsors organised another FP&A Board meeting, the subject: Rolling Forecast. Below is a review of a short presentation I gave at this FP&A Board meeting.
What is the purpose of a Rolling Forecast?
By presenting 3 different cases, you will get an idea of the range of possibilities a Rolling Forecast can have for the business. Since you can do anything with the financial software of today, finding a purpose of having a Rolling Forecast becomes essential for success (= implementation + adding value).
Case 1: Supply Side – Working Capital Management
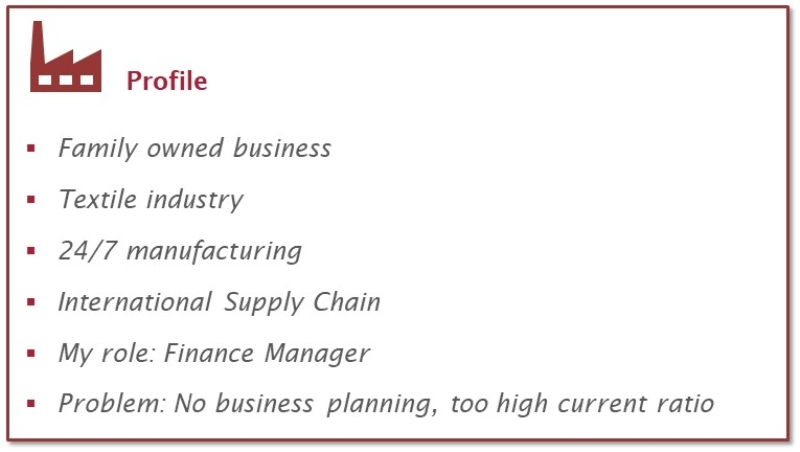
The first case is about a family business, importing raw material from different countries around the globe and always selling everything they produced. They are a low-cost producer and competition is fierce. With a 24/7 production line, as soon as a machine stops, money is lost.
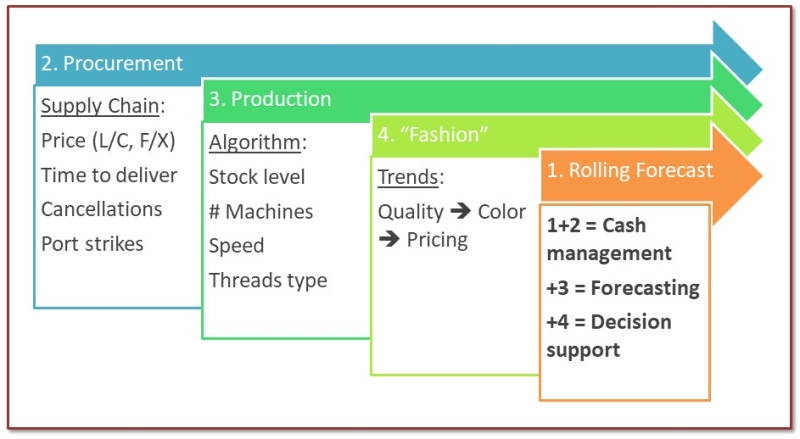
The Rolling Forecast was developed in 4 steps.
- Cash Management. The financial forecast was based on Account Receivables and Account Payables, making it just a treasury tool. Not insignificant, when F/X rates are volatile and inflation is 7%. However, working with a standard sales price and estimated sales discounts wasn’t telling the business story.
- Involving the Supply Chain. The finance manager started to involve procurement: lead times of 60 days, rates and dates on L/C and F/X contracts, suppliers ‘cancelling’ purchase orders because they sold the material to a higher bidder (without telling), and strikes and fiscal complexity at ports. Thorough knowledge of these operational risks improved the quality of the financial forecast, moving towards a Rolling Forecast.
- Adding the algorithm. With the warehouse being fully stacked (roughly minimum inventory level of 70%, because of unmanaged supply chain risks), an algorithm was developed to start predicting the real material usage. It was ‘discovered’ that when equipment was slowed down, the quality of the material would increase. This created a business opportunity: higher quality of output, although at a higher cost, leads to premium pricing. If inventory is running low, due to supply chain problems, machines wouldn’t have to stop producing. The algorithm and sales network made it possible to reduce the minimum inventory level to roughly 25%. Free cash!
- Involving ‘fashion’. Now, with the possibility of premium pricing, dyeing became a strategic ‘fashion’ choice. Premium products are being sold to a different segment, with a different taste in colour.
In the end, a Rolling Forecast of 3 months was updated daily. Having outsourced the dyeing of low-cost products, money was invested in new equipment for dyeing high-quality products. The equipment was placed at one of the preferred dyeing partners. This selected horizontal integration off-set various cost disadvantages (e.g. occupation rate, environmental license, lead time).
Case 2: Start-up – Funding
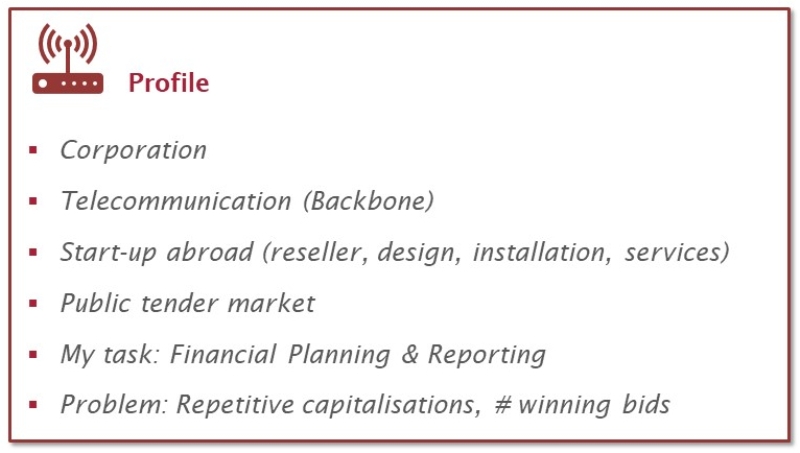
When the government opened the telecom market, multiple tenders were being developed. A start-up was set up by a foreign corporation. They organised an engineering team to be trained in the latest hardware from the supplier, to develop backbone technology solutions, and ‘helped’ to develop the technical specifications of the tenders (like all competitors did). The installation would be outsourced.
A start-up in a tender market has no revenues, only spend. This means either capitalisation through equity or through an (international) inter-company loan. In a turbulent political and economic environment, the latter can be preferred. The choice became more important once tenders were being won.
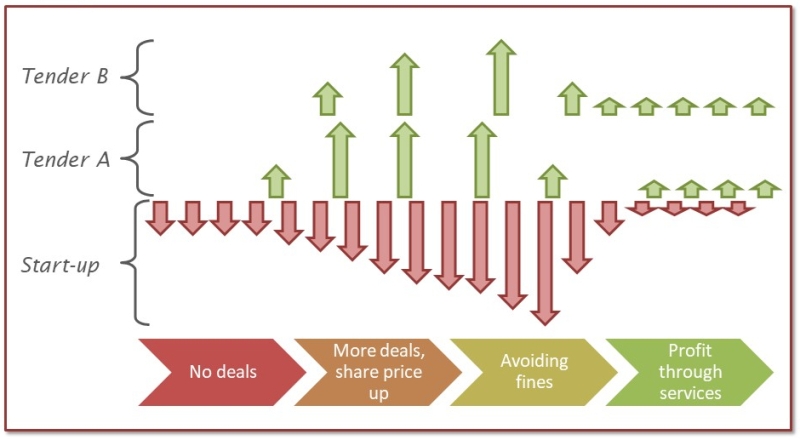
This start-up was winning most of the tenders. The share price of the corporation increased with each deal won. Cash needs increased rapidly since payments only occurred when specific milestones were achieved. Any delay in client approval at a milestone would result in a fine. Knowing that the profit margins on each tender were low, profit to the start-up (and the supplier) would have to come from services (post-installation) and network/capacity expansion contracts.
In the end, with each tender won, and using the milestones from the project plan, updating the Rolling Forecast of up to 1 year was easy. When the tender market ended, the start-up was sold. This for sure would have secured the IRR established by the corporation. Like most corporations, they weren't in the business of selling products, but selling businesses.
Case 3: Fortune-100 – Management Support
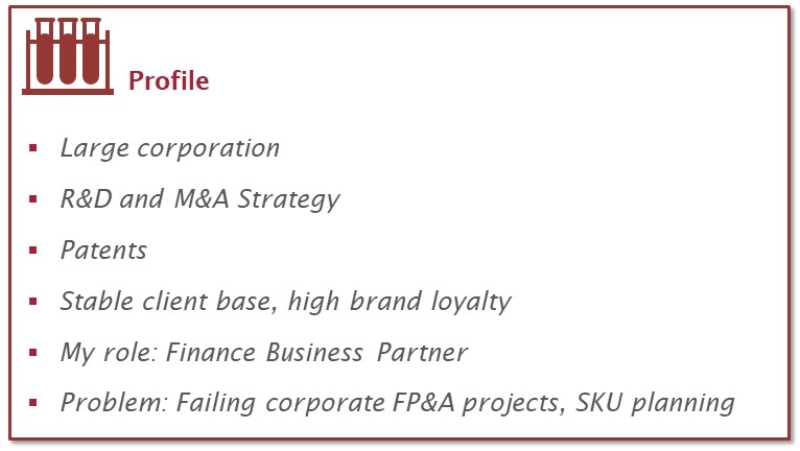
This corporation depended on R&D and M&A. Patents secured client loyalty. Local business units were mainly Marketing & Sales operations, functioning as ‘cash cows’. The command & control culture focused on permanent cost reductions, outsourcing, or the centralisation of functions at HQ. In recent years, several projects of FP&A had failed to capture and involve the local business units, due to being time-consuming and overly complex. In addition, there was no clear added value to spend (a lot of) time on highly detailed FP&A.
The business controller at a local business unit saw there was an information need towards the region. The ‘fear’ of losing information between HQ and local business was being managed through multiple, stand-alone reports. Local marketing managers were spending a lot of time on financial planning and monitoring the actual bookings of spend. Not their task!
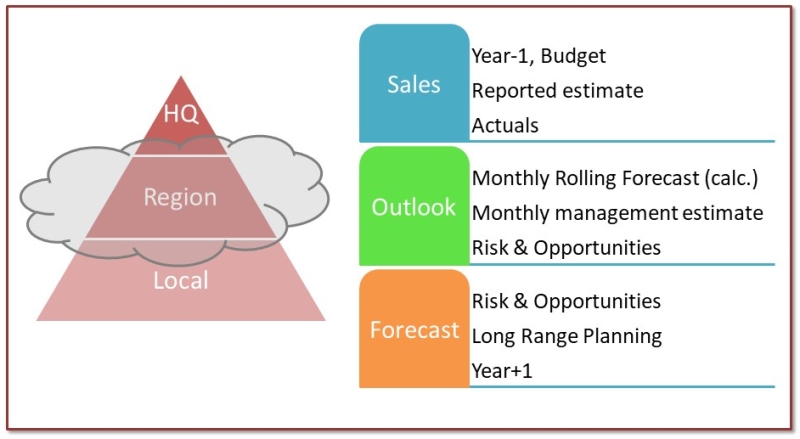
The solution resulted in a single report, generating an automated SKU planning, based on current product mix%, an automated monthly, quarterly and year-to-date P&L’s, and many more, all combined into one Excel file. However, only the first sheet was ‘interactive’. It contained (among others) the following:
- Sales: Last Year; Budget; quarterly reported Estimate of Actual Year; the monthly Actuals.
- Outlook: Rolling Forecast of Actual Year, based on an algorithm from finance; Rolling Forecast (*) of Actual Year, based on the expectation of the marketing manager; short-term Risks & Opportunities (*), which included actions, impact on sales, spend and operating profit.
- Forecast: Long-term Risks & Opportunities (*), which included actions, impact on sales, spend and operating profit; multiple year sales forecast; the extended Rolling Forecast (*) of the Next Year.
(*) Discussed and adjusted monthly.
Here, the Rolling Forecast starts as a 24-month forecast. Each month the projection would be one month less. A risk or opportunity impacting Next Year figures, would automatically be processed in the Rolling Forecast, updating the business plan for the coming year. Transparency and no surprises!
In the end, setting up the Rolling Forecast and centralising the reporting through one Excel sheet (the other sheets are automated), proved to be the most efficient and effective solution. For each product line, the marketing manager would be spending only 1 or 2 hours per month on business planning and FP&A with finance. It involved an algorithm and human input, quantitative and qualitative information, backwards and forward-looking data, relevant ratio's, and detailed (SKU) and meta (P&L) data.
Lessons Learned
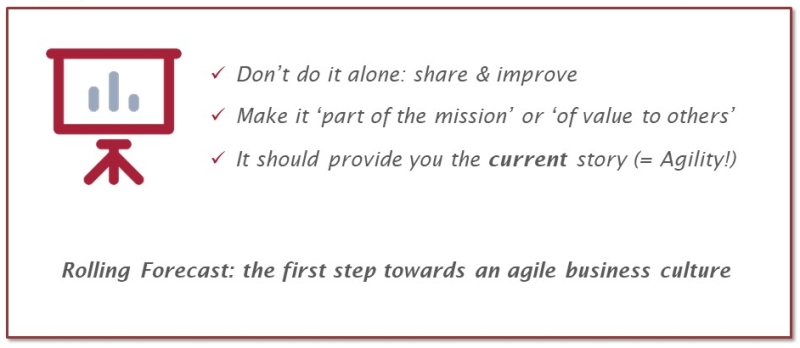
With a Rolling Forecast, business focus gets constantly being reviewed by management and effective action can be taken immediately. As such, a Rolling Forecast drives business change. When considering a Rolling Forecast:
Thanks, and enjoy the future!
Subscribe to
FP&A Trends Digest
We will regularly update you on the latest trends and developments in FP&A. Take the opportunity to have articles written by finance thought leaders delivered directly to your inbox; watch compelling webinars; connect with like-minded professionals; and become a part of our global community.