Running a company, among other things, requires dealing with ambiguity. How this is done depends on...
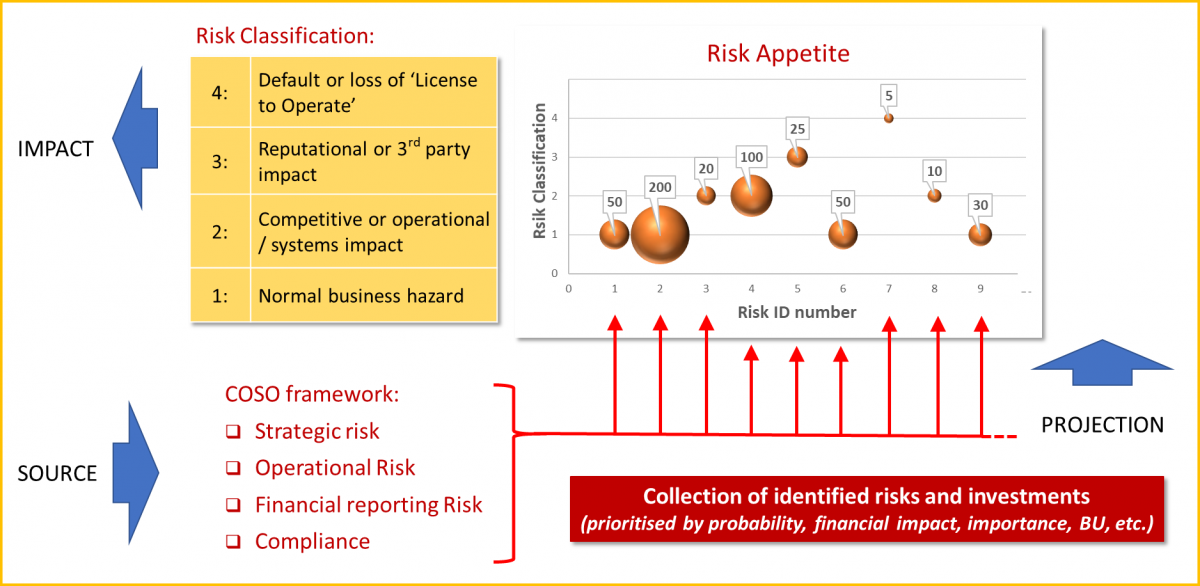
 At a corporate level, risks can be very well mapped and controlled using e.g. the COSO framework. Defining the risks is often source driven. This means: the source of the risk is identified leading to the impact being measured by the possibility of occurrence (chance) and the size of its impact on the P&L (money). How much appetite for risk does the company have to achieve its goals?
This complex area of Enterprise Risk Management (ERM) is today’s responsibility of the CFO and, if available, the Chief Risk Officer (CRO). They are the ones who influence the risk culture. Three key questions will be considered: How is risk mapped? Where is this risk appetite? And, how to manage it?
How is risk mapped?
The COSO risk framework focuses on 4 objectives: strategic, operational, financial reporting, and compliance. The financial reporting and compliance risks can be collected using some form of internal control framework:
- For each business and financial process, management and/or external experts can identify the risks and (needed) control mechanisms.
- A walkthrough audit can identify, which control activities, registrations and checks are not in place, and how to solve these issues (e.g. automate, training, new tasks, process adjustment, reporting, etc.).
- Since some of the risks will not be full-proof yet, a short list of key-risks (or rolled-up risks) can be established for the executive team to evaluate.
These two areas, financial reporting and compliance, are also a source for identifying the first operational risks (e.g. missing review of KPI’s) and some strategic risks (e.g. culture related or integrity issues). Management can elaborate on the other operational and strategic risks, making the key-risk overview complete. These are the risks that appear on risk dashboards for the executive team and boards to discuss.
Where is this risk appetite?
Risk appetite reflects how much risk the company is willing to take. It is at the core of managing risks. Through voting, expert opinion, or discussion, the list of key-risks is reviewed establishing the chance they might occur/lead to a problem, and the financial impact they probably have on the P&L.
While auditing and reviewing the (key-)risks, solutions (and opportunities!) will be suggested. Investing in these solutions shows up in the risk map, moving more risks into the green area, or making the green area larger until the remediations are in place. The area between uncontrollable risks and events and risks with remediation can be defined as the risk appetite.
How to manage risk appetite?
Defining the risk appetite of the company should not only be defined by the financial impact, available money to remediate, or chance ‘guesstimates’. Nor, should it be shaped by ‘culture’. E.g. how often can a risk occur/be allowed? Where is zero-tolerance required? When should we remediate? These questions call for the need to classify risks differently.
The list of (key-)risks could be classified as follows:
- Normal business hazard
- Competitive or operational/systems impact
- Reputational or 3rd party impact
- Loss of ‘license to operate’ or default
These 4 indications show who will be responsible for managing that specific risk, and who is responsible for establishing limits or approve actions. Classification makes the levels of risk and risk appetite transparent. It makes the risk ‘culture’ visible.
From the risk areas, strategy, operations, financial reporting and compliance, the financial impact is just one classification. The consequence for each business might be different and it is up to Risk Managers and FP&A professionals to deal with these risks. Both are business partners bringing risk awareness to staff and management. By classifying the impact of risks differently, a shortcut is obtained to effectively communicate and manage the risk appetite and influence the risk culture.
The article was first published in Unit 4 Prevero Blog
Subscribe to
FP&A Trends Digest

We will regularly update you on the latest trends and developments in FP&A. Take the opportunity to have articles written by finance thought leaders delivered directly to your inbox; watch compelling webinars; connect with like-minded professionals; and become a part of our global community.


