

Inside this article are the bread and butter ratios of financial statements. Some gauge effective use of assets. Some report the financial condition of the company. It is with these the ratios (relationships) where most financial analysis begins. They are powerful in both developing forecast statements, assessing performance and validating model output. What I am outlying here is the very core of virtually all financial analysis output.
Recapping, the purpose of corporate finance is to maximize shareholder wealth. Maximizing shareholder wealth requires asset management, investment management and financing management. Sometimes corporate finance is managing “as is” assets in place. Sometimes corporate finance is managing what it believes the future may hold so it may properly position itself today (investment and future growth opportunities). And to execute asset, investment and financing decision making we must accurately assess both parts of our fundamental valuation equation: CF/r.
Valuation is, by concept, forward-looking. Therefore, both CF and r require forecast figures. Forecast figures require a base of observations from which to draw inferences for the estimation of future events and circumstances. Internally, our base of observations are our historic statements. The inferences are our drivers. These drivers are most often expressed as ratios (% of X) or adjusted actuals (X(1+g)). Or a combination of both.
Drivers must be based on proven relationships which have stood the test of time (the “use test” as referenced in Basel II) and must be adjusted as warranted (“subjective overlay”). This combines fundamental storm weathered statement analysis technique and subject matter expertise.
Please take note that the words “big data”, “transformation”, “analytics” will not appear in this text. This is because:
The single greatest empowerment to FP&A in the 21st century is the fundamental financial theory and statement analysis developed over the past 80 years.
The Basics
- Que in on published material and Executive guidance
- Observe trends and existing relationships
- Use your textbook ratios for analysis, KPIs and output validation
- Common size
- Look year over year
- All costs are semi-fixed, ultimately
- Normalize figures by using informed adjustments (SME)
A Word on Drivers, Rations and KPIs
- Drivers steer $ or utilization figures/metrics as inputs. A driver may also be a key performance indicator, but they are usually used from an input perspective (independent variable). A driver or metric may be keyed in on by executive management, but only to the extent that a KPI was not met.
- KPIs measure performance output. They are generally dependent variables.
- There can be crossover, but keep on mind that the term "KPI" is a relatively new naming convention.
- Drivers and KPIs are often expressed as ratios. Some ratios may be neither drivers nor KPIs, but they relate important information concerning the health and position of a firm and can be used as model output validation. A KPI to one party (a debt holder, for example) may not hold the same weight or meaning as a KPI to another stakeholder.
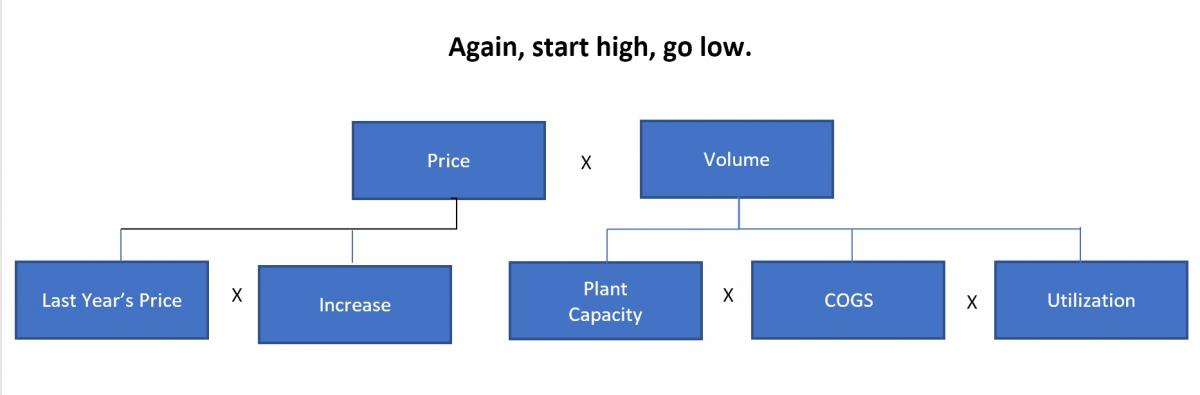
Starting a Forecast: How Do We Begin?
Start high, go low as data allows, and improve insight over time. Start with fundamental drivers and statement formats. Stats and drill down database techniques will someday further enhance the process downstream in your model. Here is an income statement summary. Start here, pull apart later on.
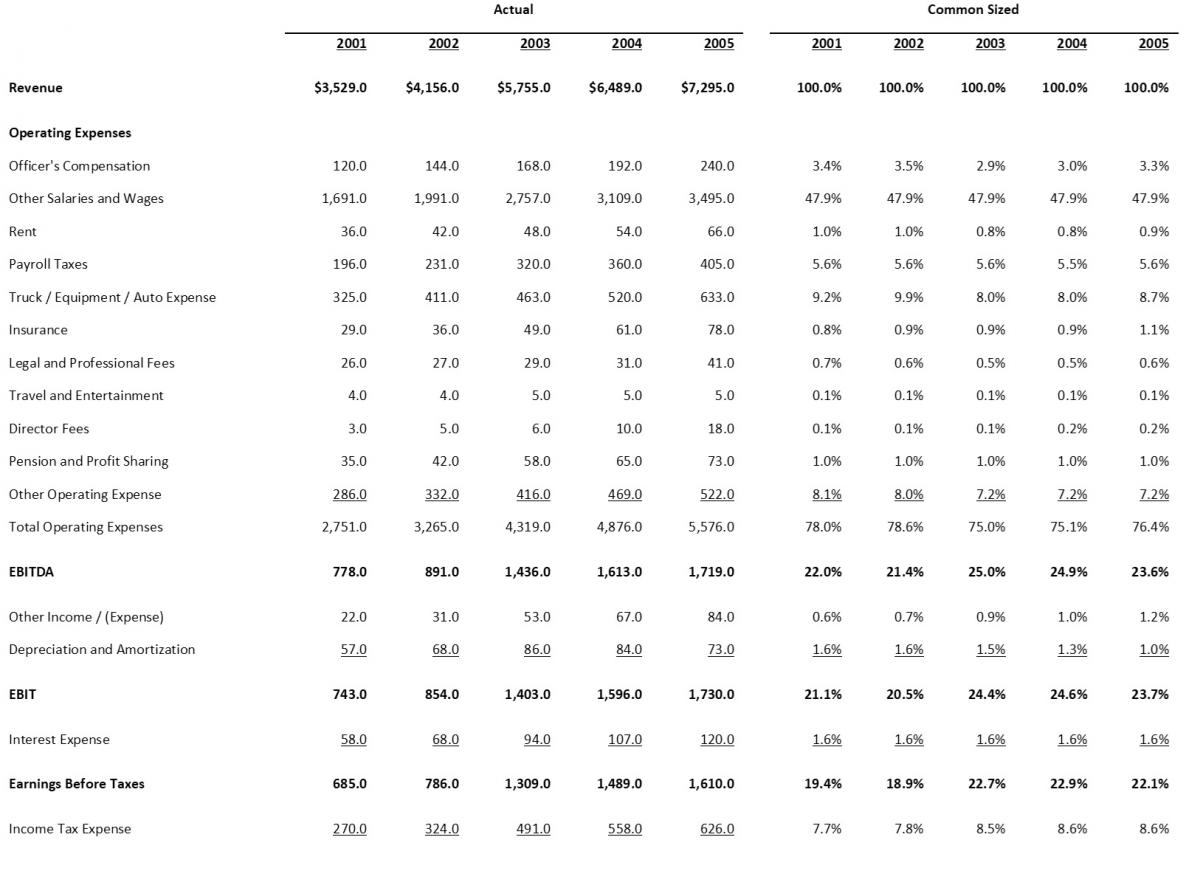
Common sizing statements is a good start for financial statement forecasting.
From Investopedia: What is a 'Common Size Income Statement’. “A Common size income statement is an income statement in which each account is expressed as a percentage of the value of sales. This type of financial statement can be used to allow for easy analysis between companies or between time periods of a company.”
One obvious result to the common sized income statement are sub-margins and net margins. Makes for good M,D&A discussion and general trend analysis, especially for variable costs.
Also useful is a common sized balance sheet statement. It will flush out casual relationships quickly.
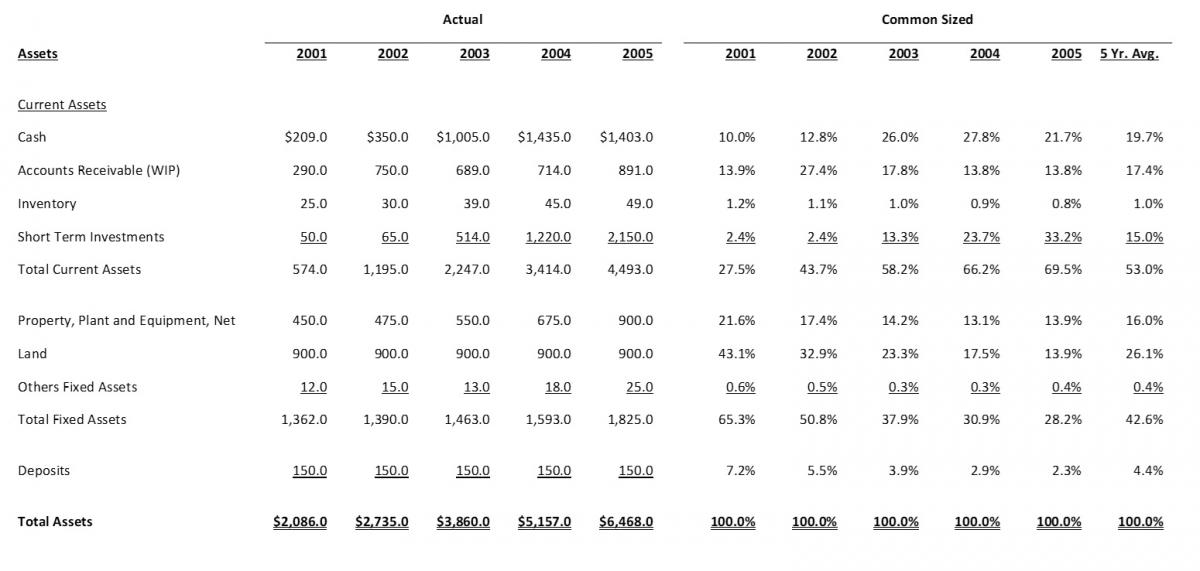
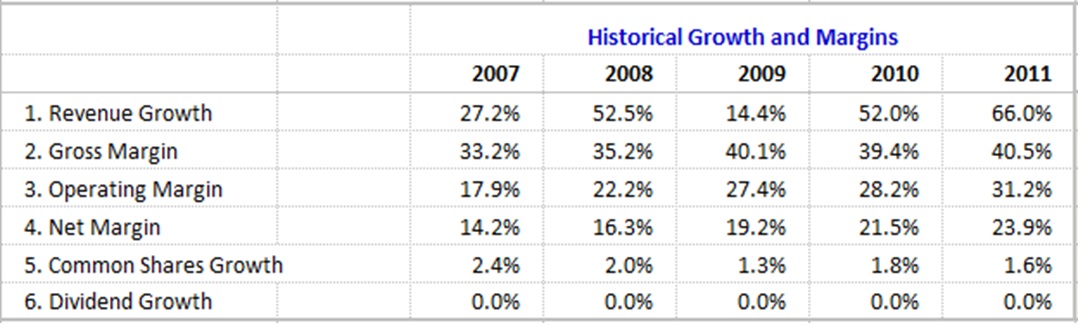
“Horizontal” common sized statements show year over year changes, or “growth”. Very simple, easy to execute and powerful as sanity checks and in more formal validation. Trends become apparent, as do anomalies. The chart below is the work of Robert A. Weigand, Ph.D. It is simple, clear and concise.
Classification of Ratios/KPIs and Definition of Terms
Ratios can be divided into four main categories. These may also be used as KPIs, depending on need, circumstance and executive directive:
- Activity Ratios
- Liquidity Ratios
- Debt and Solvency Ratios
- Profitability Ratios
These ratios provide checks for development, statement management and validation. Is model output reasonable and does it follow accepted patterns? Ratios not only reflect the financial position of a firm but may also reflect a model’s calculation abilities and errors. These ratios reflect either casual relationships, times series relations or naïve (flat) relationships.
|
Expense Ratios |
|
|
Operating Expense % of Revenue |
Operating Expenses / Revenue |
|
Turnover Ratios |
|
|
Receivables Turnover |
Revenue / [[A/R Beg. Balance + A/R Ending Bal.]/2] |
|
Fixed Asset Turnover |
Revenue /[ [Fixed Asset Beg. Balance + Fixed Asset Ending Bal.]/2] |
|
Total Asset Turnover |
Revenue / [[Total Assets Beg. Balance + Total Assets Ending Bal.]/2] |
|
Risk / Leverage Ratios |
|
|
Current Ratio |
Current Assets / Current Liabilities |
|
Debt / Equity |
Total Interest-Bearing Debt / Total Equity |
|
Interest Coverage |
EBIT / Interest Expense |
|
Profitability Ratios |
|
|
EBIT Margin |
EBIT / Revenue |
|
Net Margin |
Net Income / Revenue |
|
NCF % Revenue |
Net Cash Flow / Revenue |
|
NCF % of Net Income |
Net Cash Flow / Net Income |
|
Return on Assets |
Net Income / [[Total Assets Beg. Balance + Total Assets Ending Bal.]/2] |
|
Return on Equity |
Net Income / [[Equity Beg. Balance + Equity Ending Bal.]/2] |
|
Growth Ratios |
|
|
Revenue Growth |
[[Revenue2 / Revenue1] -1] |
|
Earnings Growth (EBIT) |
[[EBIT2 / EBIT1] -1] |
|
Earnings Growth (Net Income) |
[[Net Income2 / Net Income1] -1] |
Causal Relationships
With causal relationships, analysts examine the cause-and-effect relationships of a variable with other relevant variables such as the level of consumer confidence, an income statement or balance sheet item. Below are examples of common causal relation calculations:
- Position calculations represent a company's financial position regarding earnings, cash flow, assets or capitalization. Calculations can be expressed as a dollar amount, a percentage, or a comparison. Position calculations are often referred to as “common-sized” when it is uniformly applied to a whole statement.
- Cash % Assets
- Debt / Equity
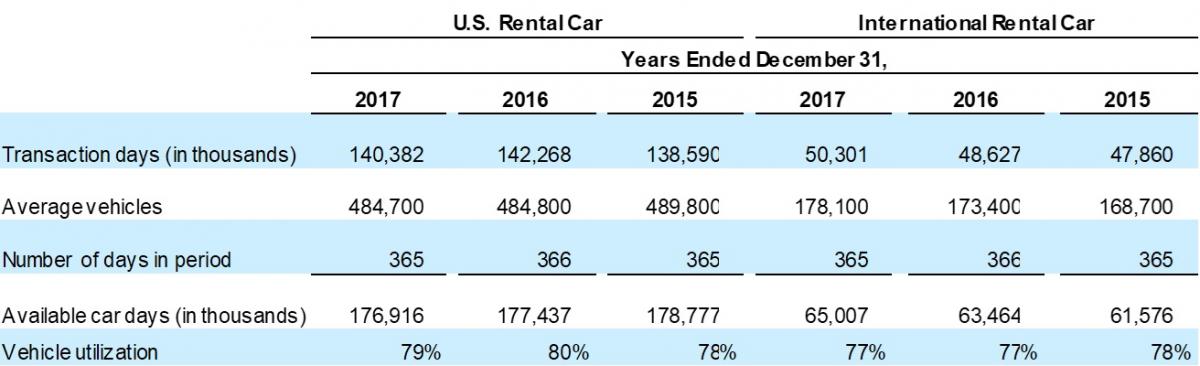
- Metric calculations assess financial position relative to a non-financial figure such as days, transactions or number of customers.
- Transaction Figures (Units Sold Per Day, Transaction Days, etc.)
- Utilization %
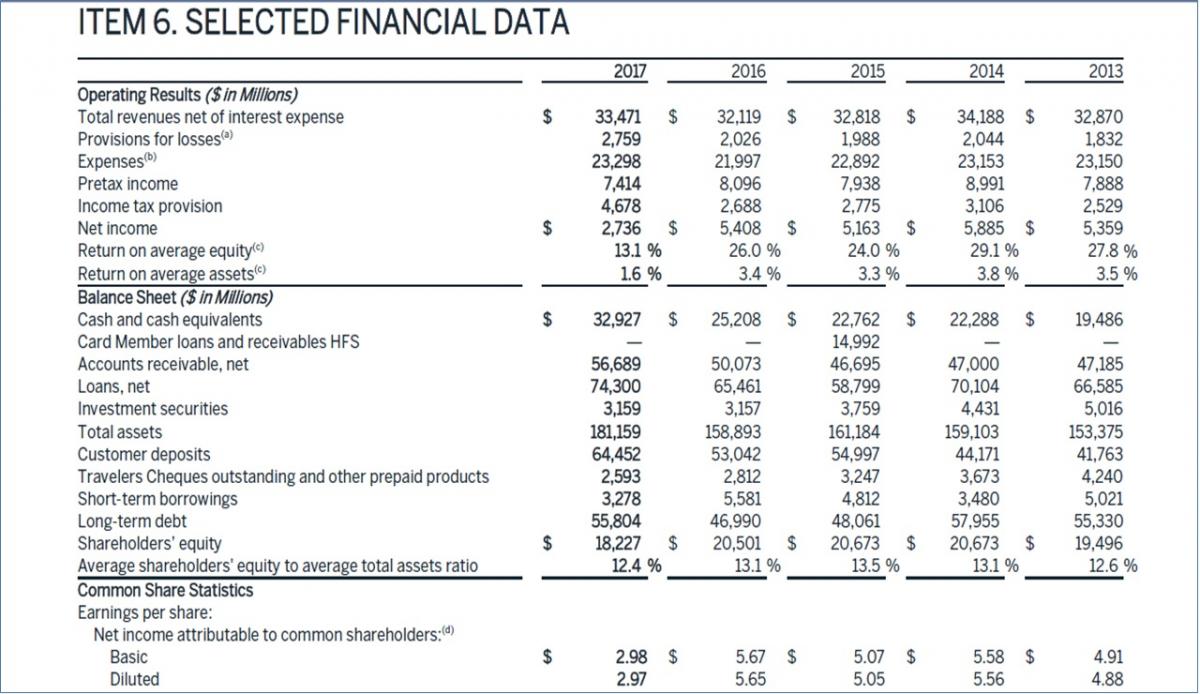
Below, the Hertz 10K includes some great metrics to use as starting points in a forecast:
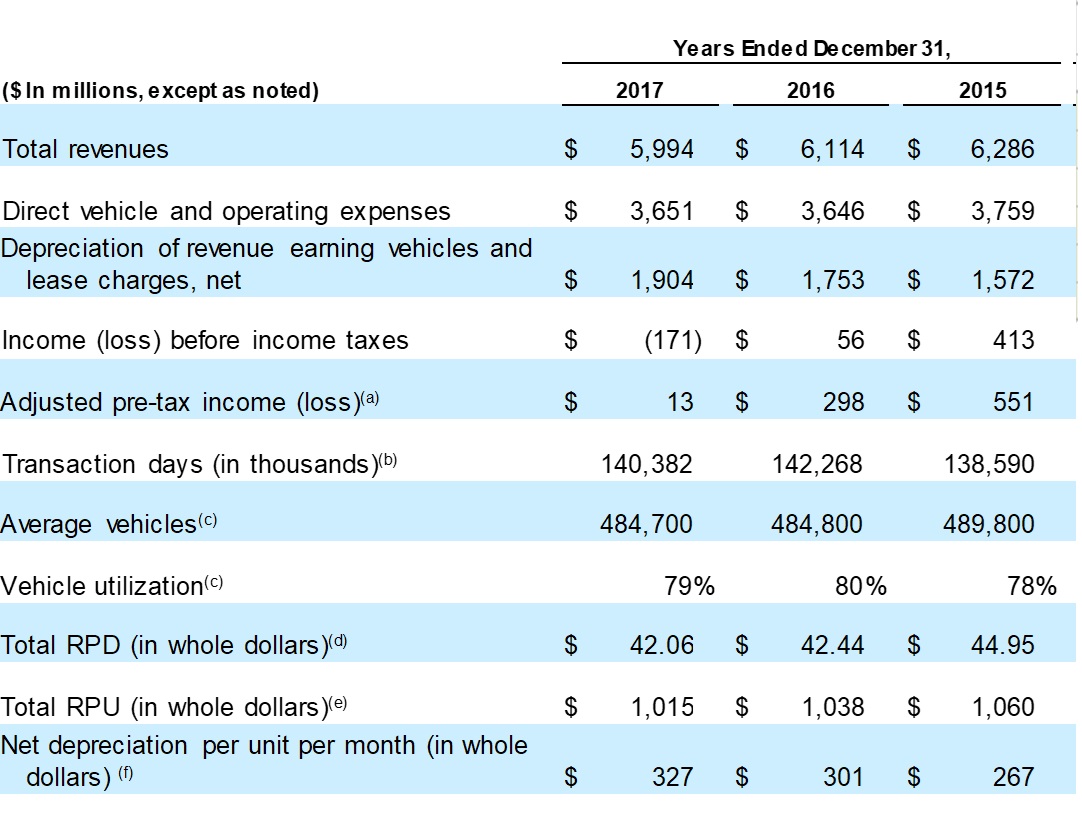
Here are some well used financial statement metrics used to develop line items for forecasts:
Assets
- Cash % of revenue
- Cash % of assets
- Inventory % of sales
- Accounts receivable % of sales
- Accounts receivable based on days outstanding
- Short term securities % of debt
- Short term securities % of cash
- Depreciation and amortization function of first cost
Liabilities
- Payables % of cost of goods sold
- Debt function of D:E target
- Dividend result of D:E target
Income Statement
- Revenue = price x volume
- Cost of goods sold % of revenue
- Selling expenses % of revenue
- Depreciation function of first cost of asset
- Interest expense % of average debt balance
- Taxes at tax rate
A widely-known causal method is regression analysis, a technique used to develop a mathematical model showing how a set of variables are related. Regression analysis that employs one dependent variable and approximates the relationship between these two by a straight line is called a simple linear regression. Regression analysis that uses two or more independent variables to forecast values of the dependent variable is called a multiple regression analysis.
Time Series Relationships
Time series relationships move from period to period, albeit daily, weekly, monthly, quarterly, seasonal or cyclical. Here are some other financial statement metrics used to develop line items for forecasts which are a result of year over year changes:
- Price
- Volume
- Cost of Goods Sold (Price x Volume)
- SG&A
- Non-recurring and one-time expenses such as legal fees
Semi-Fixed Costs
- Not all costs can be evenly divided between fixed and variable. Though the same underlying methodologies and techniques apply.
- Here is the classic formula:
“The formula for total fixed cost is fixed costs plus variable costs multiplied by quantity equals total cost, or
FC +VC(Q)=TC, according to Education Portal. Fixed costs are costs that do not change based on aspects such as production levels, where variable costs change based on production.” Reference.com.
This simple formula cab be further refined by further breaking apart fixed and variable cost, weighted.
- Keep in mind, conceptually all costs are neither fixed nor variable in their entirety.
From Investopedia:
Breaking Down 'Semi-Variable Cost
The fixed portion of a semi-variable cost incurs repeatedly, while the variable portion occurs as a function of the activity volume. Management may analyze different activity levels by manipulating the activity level to the variable costs. A semi-variable cost with lower fixed costs is favorable for a business as the breakeven point is lower.
Examples of Semi-Variable Costs
Overtime on a production line has semi-variable features. If a certain level of labor is required for production line operations, this is the fixed cost. Any additional production volume that requires overtime results in variable expenses dependent on the activity level. In a typical cellphone billing contract, a monthly flat rate is charged in addition to overage charges based on excessive bandwidth usage. A business likely experiences a similar structure when charged for utilities. Also, a salesperson’s salary typically has a fixed component such as a salary and a variable portion such as a commission.
A business experiences semi-variable costs in relation to the operation of fleet vehicles. Certain costs, such as monthly vehicle loan payments, insurance, depreciation and licensing, are fixed and independent of usage. Other expenses including gasoline and oil are related to the use of the vehicle and reflect the variable portion of the cost.
Production Volume
The fixed portion of a semi-variable cost is fixed up to a certain production volume. This means certain costs are fixed for a range of activity and may change for different activity levels. For example, rent expense for a production facility may be $2,000 per month. However, if production doubled and an additional facility is rented, the new fixed rent charge may be $3,500. This charge remains fixed even though the dollar amount changed because the production volume was adjusted.
Accounting for Semi-Variable Costs
Generally accepted accounting principles (GAAP) do not require a distinction between fixed and variables costs. These costs are not distinguished on a company’s financial statements. Therefore, a semi-variable cost may be classified into any expense account such as utility or rent. A semi-variable cost and analysis of its components is a managerial accounting function for internal use only.”
Normalized and Recast Statement Adjustments
The purpose of normalizing financial statements is to adjust the financial statements of a business to more closely reflect its true economic financial position and value conclusions of operation on a historical and current basis. Common normalizing adjustments include balance sheet adjustments to bring asset values to current market values, and income statement adjustments to reflect standardized revenues and expenses.
Recast statements reflect the unique financial statement structure of an entity, taking into account unusual or non-recurring revenue and expenses.
Here is an example from a valuation for the proposed sale of a business:

Ratios, metrics and KPIs serve little purpose if not adjusted for abnormal and non-recurring events, especially on a comparative basis.
Benchmarks as Drivers and Validation Indicators
Internal Benchmarks
- Prior Year Results
- Alternative Estimates
- Subjective Reasoning
External Benchmarks
- Industry Norms
- General Economic Activity
Drivers and Forecasting: An Example

Traditional Statement Rules
Here are some time tested financial statement techniques and rules of thumb:
| Balance Sheet | Always balances. |
| Working Capital | A function of operations with few exceptions such as the current portion of long term debt. |
| Debt | Built from asset’s ability to obtain financing, possibly drawn down to zero or maintained at a certain debt to equity ratio. |
| Debt: Equity |
Acts as the “keel” to the balance sheet. |
| Equity | Cash is not run up, dividends are used to balance assets and liabilities plus equity. |
| Cash flow | A function of balance sheet and income statement. Often produces a “hypothetical” dividend, as companies may choose retain excess cash as opposed to issue a dividend. |
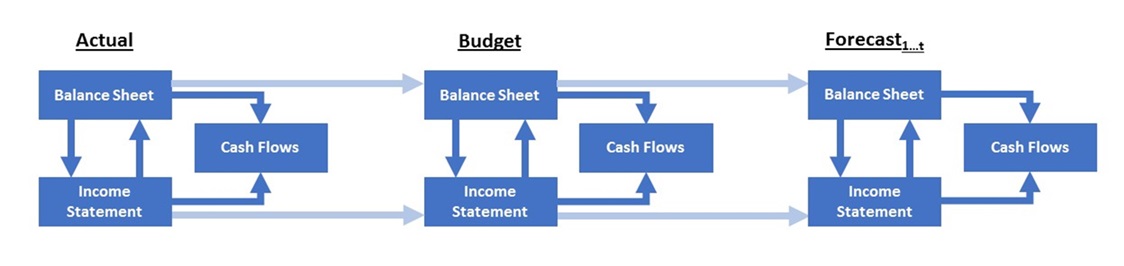
Integrating Statements
Both conceptually and mechanically, integrated statements, by acknowledging the balance sheet-income statement-cash flow interdependency, demonstrate a core understanding of corporate finance synthesis and provide a foundation for both accounting and modeling structure. This is why the investment banks and Big Four consulting firms go to great lengths to develop this skill in their incoming analysts. Without integrated statement forecasts, accompanying DCFs are likely to not hold upon to scrutiny.
Integrated statements can create circular references such as this:
- Interest expense on the income statement is a function of an average debt balance on the balance sheet.
- Current net income is dependent upon interest expense.
- Balance sheet equity is dependent upon current period net income.
- Debt is dependent upon total capitalization
- Total capitalization is dependent upon equity.
Though conceptually correct, avoid circularity. Circular references within circular references can trip up Excel (yes, I have seen it happen). This can be solved by using a goal seek macro, for instance, maintaining a debt to equity level through all model periods.
However this is handled, the best integrating approach will reflect the actual management approach employed in the organization.
Building the Bottom of the Balance Sheet
βeta - Operating and Financial Risk
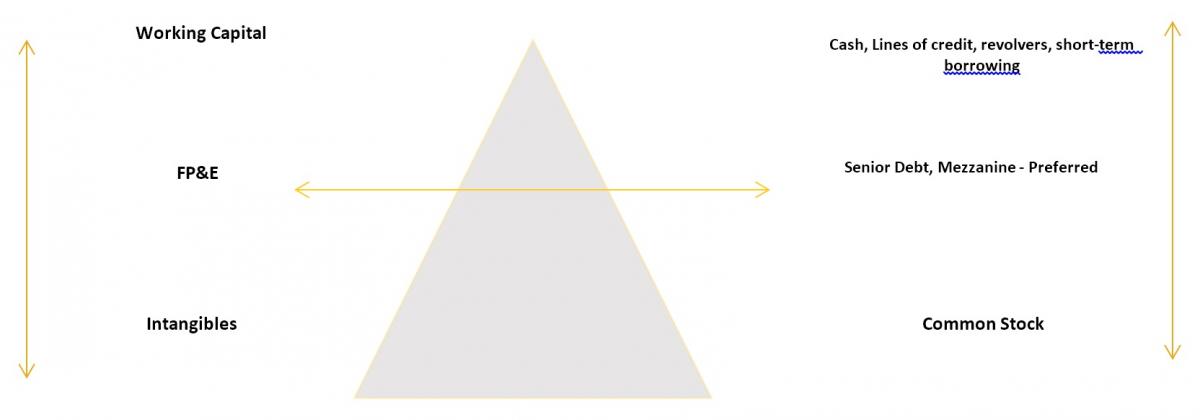
- Fixed assets act similar to debt when it comes to risk. They are a fixed cost.
Both sides of the balance sheet can be divided into fixed and variable costs. Fixed costs create leverage. They also create reward once covered, since all else falls to the bottom line after. This can make your statement forecasting somewhat easier than might be envisioned. Match your debt to the assets which they support.
The below image follows what is called the Pecking Order Theory. Developed by Stuart Myers, this theory says that businesses follow a hierarchy of financing sources preferring internal financing first. In effect, this theory starts at the top of the balance sheet (cash) and works its way down through secured and unsecured debt to common stock.
- Internal financing
2. Then debt
3. Finally, issuing equity
Each asset has its own debt to equity. For example, a car can be easily financed with debt. Ideas and intangibles cannot. It’s really that simple. The bottom of the balance sheet is a function of the weighted debt to equity of the assets on the top of the balance sheet.
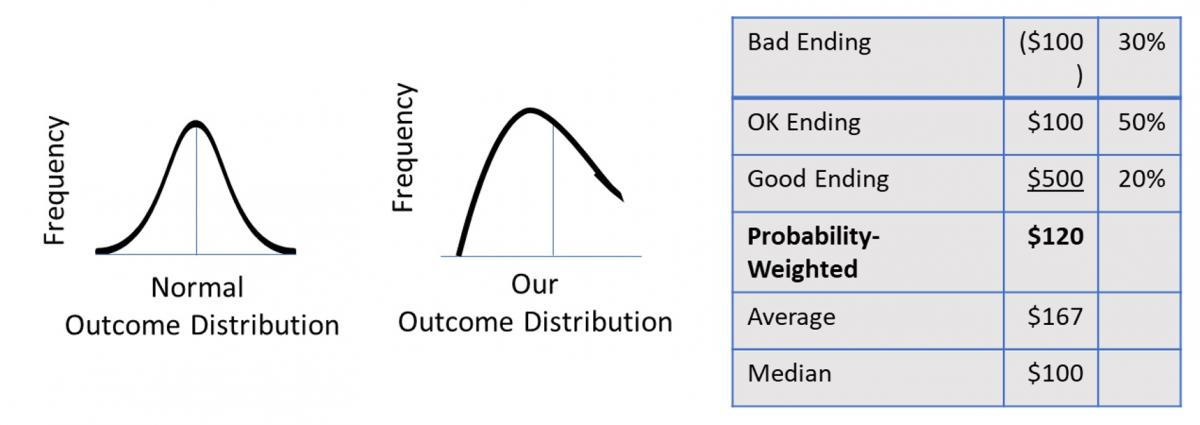
Probability Expected Values
Ideally, forecast cash flows should be probability-weighted. In other words, they should be “statistically expected” values. This is not always practiced. The discount rate in the denominator will reflect a risk return requirement assuming a distribution of outcomes; so should the cash flow.
No more than one outcome may actually occur, and thousand of years of human experience tells us that realized cash flows tend to be lower than the “most likely” forecast. In a symmetrical distribution, the most likely outcome is equal to the probability weighted outcome. Asset capacity and elasticity constraints (utilization rates), however, usually prevent this distribution from occurring in real life.
Forecasting Risks
- Incorporating only a few possible CF outcomes into analysis. No one is suggesting that Monte Carlo simulation is run for all analysis, but having a clear understanding of sensitivities to variables and the possibility of more than a few outcomes is key.
- Model errors
- Model omissions, such as P&L impacts, ignoring the PV of new opportunities projects may present, etc.
- Compounded growth
- Incorrect application of theory (tax effects, mismatched cash flows and discount rates, TV, etc.)
Great Reading
Here is a great textbook for learning and reviewing common financial statement ratios and analysis:
The Analysis and Use of Financial Statements, White, Sondhi and Fried.
About the Author
Rob Trippe is a highly accomplished MBA, investment bank trained, Fortune 10 and 200 corporate finance leader for strategy and planning with a focus on model risk, analytics and project finance. Rob’s had the Fortune of working and learning from some of the finest companies in the world; GE, Houlihan Lokey and Hertz.
Rob is a "wing to wing" corporate finance model and project manager. He consults, lectures, and writes about corporate finance and financial modeling exclusively and extensively. Rob has developed financial models spanning every balance sheet asset and capitalization class, numerous industries and for a variety of decision-making and regulatory purposes and applications. The commonality across these dimensions? Core theoretical concepts, model governance and best in class model structure.
Subscribe to
FP&A Trends Digest
We will regularly update you on the latest trends and developments in FP&A. Take the opportunity to have articles written by finance thought leaders delivered directly to your inbox; watch compelling webinars; connect with like-minded professionals; and become a part of our global community.