
In this article, discover how FP&A can achieve data mastery by transforming low-value data tasks into...

Investigating Marginal Revenues and Costs: Turning Data into FP&A Insight
November 20, 2025

In Part I, we explored how FP&A can use the Growth & Profitability Matrix as a framework to discuss financial results by focusing on marginal revenue and costs, rather than averages. In this second part, we turn to the practical tools FP&A can apply to the modelling, including both segmenting revenues and expenses over larger time periods.
Creating Mental Models by Segmenting Revenue Growth
Daniel Kahneman’s book, Thinking Fast and Slow, explains how people make decisions using two distinct systems: System 1, which is fast, intuitive, and relies on mental shortcuts (heuristics), and System 2, which is slower, more deliberate, and grounded in data-driven analysis. Breaking it into 3–5 categories strikes a powerful balance when it comes to revenue segmentation.
This range is intentional: it aligns with how leaders naturally process information, offering enough complexity to surface meaningful insights, but not so much that it overwhelms, allowing them to use System 1 thinking to make quick decisions. Too few segments risk oversimplification; too many can paralyse action as it requires a switch to System 2.
By working within this 3–5 segment framework, leaders can construct a mental model that bridges macro trends with micro realities, enabling sharper comparisons and more strategic decisions within our Growth & Profitability Matrix. It also allows us to harness the law of large numbers, revealing how individual choices ripple across the broader system, illuminating both personal and organisational impact.
Once we have segmented the data into 3-5 groups, we can observe how differential growth rates across segments alter the business mix over time.
An example of segmentation is illustrated in Figure 1, where revenue is divided into three segments and tracked over a two-year period. For example, imagine $100 in revenue is split into three segments:
- Segment 1 accounts for 50% with a 2% growth rate
- Segment 2 accounts for 30% with a 27% growth rate
- Segment 3 accounts for 20% with a 5% growth rate
This structure reveals how faster-growing segments can shift the composition of the business, impacting strategy, investment, and talent deployment.
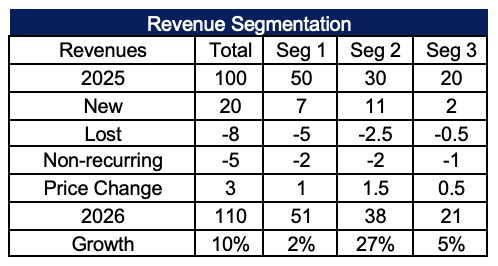
Figure 1. Revenue Segmentation Example (2025–2026)
Here’s a visual showing how business segment composition evolves over 5 years based on differential growth rates:
- Segment 1 (2% growth) shrinks from 50% to 35%
- Segment 2 (27% growth) expands from 30% to 50%
- Segment 3 (5% growth) declines slightly from 20% to 15%
The pie graphs below use a body composition analogy: investing in high-growth segments (Segment 2) is like building muscle, while slower-growth segments represent fat. Over the years, differential growth reshapes the mix of business segments, as shown in Figure 2. High-growth areas expand their share, while slower-growth segments contract — fundamentally changing strategy and resource allocation.
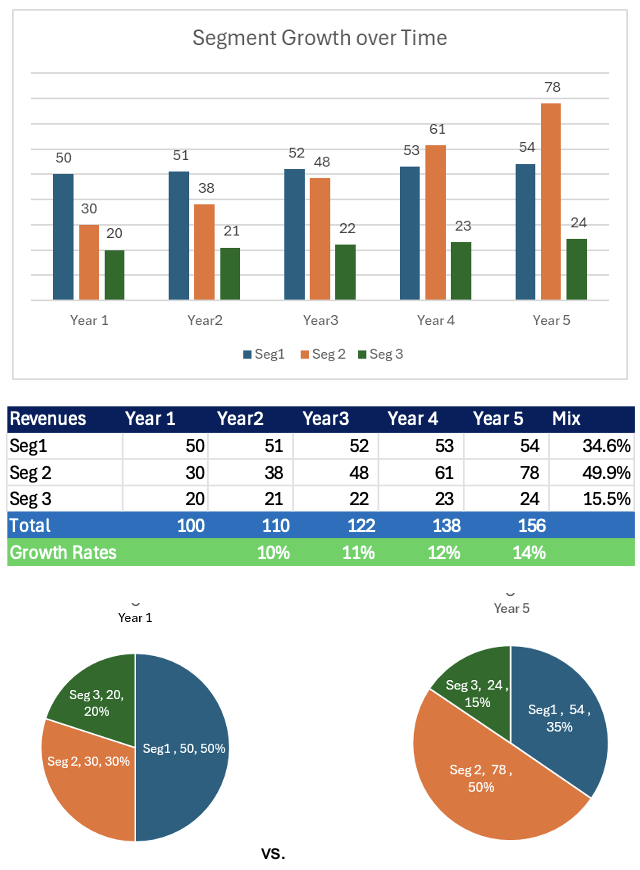
Figure 2. Business Mix Shift Over Five Years
While growth rates are rarely uniform, it’s essential to understand which segments are growing and which are not. This enables FP&A to guide resource allocation, ensuring we’re fueling the right areas of the business.
A common bias in this analysis is the temptation to ask:
“How do we get the 2% growth segment to grow at 10%?”
While well-intentioned, this is often a fallacy. The marginal cost of accelerating a slow-growth segment is typically much higher than the cost of sustaining a fast-growing one due to high-growth segments benefiting from competitive advantages like market positioning, product differentiation, or operational leverage. Trying to force growth in a low-performing segment may require disproportionate effort, investment, and risk without the same expected returns.
FP&A’s role is to make sure this data is evaluated when making investment decisions, helping leaders resist the urge to “fix” slow-growth areas at the expense of scaling what’s already working.
Segmenting Compensation
While it’s helpful to measure compensation by revenue segment, another layer of insight is segmenting compensation by talent composition. We use a sports analogy to classify employees into three categories:
- Star athletes: high performers driving outsized impact
- Role players: reliable contributors supporting team execution
- Developing: emerging talent with growth potential
Understanding the ratio of stars to role players and how they function together is key to team performance. Just like in professional sports, stars can age or get injured, role players need stars to thrive, and emerging talent requires mentorship to develop.
In FP&A, we measure this “team composition” using cost accounting metrics: changes in headcount and raises as these impact the P&L. These metrics help us track how compensation evolves and whether we’re investing in the right mix of talent to support sustainable growth.
An 8% growth model example shows how compensation shifts across talent tiers. This allows us to assess not just cost but also the strategic quality of our investment in people.
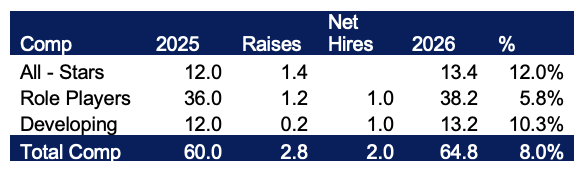
Figure 3. Compensation Segmentation by Talent Type
One of the key constraints to scaling a business is the ability to develop enough leaders. Growth isn’t just about adding headcount; it’s about building a team that can lead, execute, and adapt.
While we may have official metrics to classify talent, partnering with the business and HR is equally important to align on classifications. There’s often a subjective layer to evaluating leadership potential that goes beyond pure metrics.
The goal for sustainable growth is to increase the proportion of all-stars while maintaining a healthy mix of role players and developing talent.
As shown in Figure 4, adding two employees per year over five years, the team composition shifts — stars increase from 20% to 22%, role players grow by three, and developing players grow by two.
FP&A can help guide this evolution by modelling how team composition changes over time and aligning it with business strategy. It’s not just about cost, it’s about investing in the right mix of talent to support long-term performance.
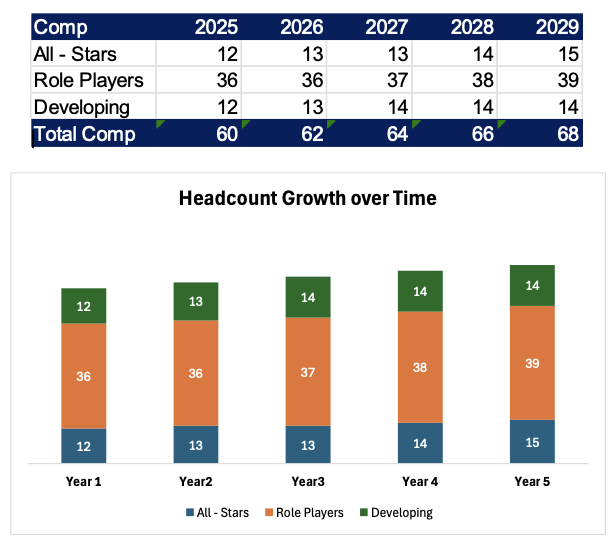
Figure 4. Headcount Evolution by Talent Type (2025–2029)
Key Takeaways for FP&A Leaders
Focus on marginal revenue and expenses rather than average expenses to understand growth trends against the Growth and Profitability Matrix.
Look at marginal revenue and expenses within 3-5 segments to determine what drives revenue growth and profitability changes.
Examine expenses as an investment, breaking down into components as well. We can examine people on teams with different positions and responsibilities. Getting the right mix of people is critical to having a successful team.
In Part III, we will examine how we can use both the Growth and Profitability Matrix and the segmentation school as part of our continuous business monitoring.
The full text is available for registered users. Please register to view the rest of the article.
Related articles

In this article, learn how FP&A leaders can use the Growth and Profitability Matrix to balance...

One of the most important aspects of the FP&A role is to be able to provide...

In this series of articles, we delve deeper into the importance of finding the right balance...

Among FP&A challenges understanding, explaining and forecasting revenues evolutions are one of the top items. It...

In this article, the author outlines how to effectively bridge the gap between finance and marketing...
+
Subscribe to
FP&A Trends Digest
We will regularly update you on the latest trends and developments in FP&A. Take the opportunity to have articles written by finance thought leaders delivered directly to your inbox; watch compelling webinars; connect with like-minded professionals; and become a part of our global community.