
In this article, learn how FP&A teams can turn marginal revenue and cost data into actionable...

Crunch the Data, Drink YogoSmile! From Analytics to Action
December 4, 2025

Introduction
Today, data analysis has become essential for organisations. Yet, across different sectors and practices, many debates remain unresolved in meetings. Different perspectives often lead to misunderstandings in management discussions, obscuring the value of data-driven decisions.
The dynamics examined in this article concern a case study of a yoghurt company, "YogoSmile" (a fictitious name), whose sales — measured as the number of standard-weight 125g jars — were recorded monthly from January 2015 to December 2021. The time series, consisting of equally spaced sales observations, reveals recurrent patterns with peaks and troughs, highlighting the seasonal nature of yoghurt demand.
This analysis includes a forecast for 2022, created to assess predictive accuracy and support management decisions. For managers, these patterns feel like a rollercoaster, making it difficult to identify the risks and opportunities they involve clearly.
This highlights the need to balance sales strategies with inventory, financial, and production management. The following sections demonstrate how data analysis can assist managers in making informed decisions in this context.
Keywords
Decomposition, Forecasting, Trend, Seasonality, Time Series, Modelling Evaluation, Data-Driven Decisions
Data Description and Methodology
YogoSmile is a small producer in its country, with a market share of approximately 8%. The company operates exclusively on the domestic market, where its position has been consolidated over several years.
From Figure 1 below, the sales realised over seven years are clearly evident. There are periodical peaks in March and September, and remarkable drops in May and October. This recurring pattern indicates clear Seasonality, with high consumption during certain periods and lower consumption in others.
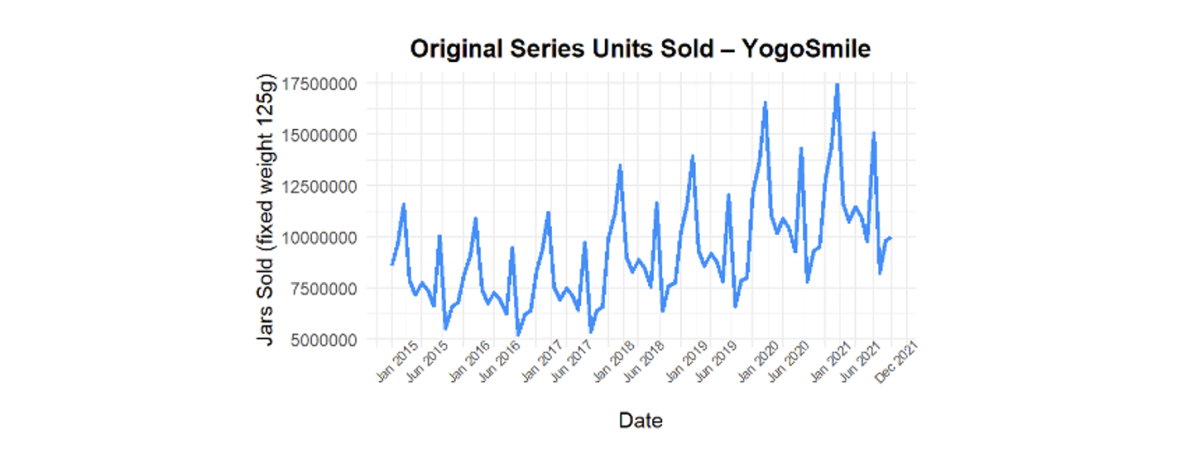
Figure 1. Original Series Sales of Units Sold-YogoSmile
Additionally, the plot shows a systematic increase in sales starting from 2018. At first sight, two main elements characterise the sales dynamics: Seasonality and a growing trend.
To analyse these aspects, it is necessary to decompose the time series into its main components with the Seasonal-Trend with Loess (STL) procedure (Cleveland et al., 1990):
- Trend: The regular and long-term direction in sales over the years
- Seasonality: The repeating fluctuations connected to specific months
- Remainder: The irregular variations not explained by either Trend or Seasonality
In Figure 2 below, the time series decomposition is shown. This visualisation helps us better understand the different components of the original sales of YogoSmile.

Figure 2. Decomposition of Sales in Trend, Seasonality, and Remainder of YogoSmile
1. Trend
The Trend component in red represents the underlying long-term direction of YogoSmile’s sales. The trend line reveals a substantial increase in sales of standard yoghurt formats, with a remarkable growth occurring during the pandemic period and a specific rise already evident in 2019. In general, the trend gives the general direction of sales. On the other hand, it considers the company’s overall trajectory along the relevant period.
This steady rise provides management with a reliable foundation for future planning, investment decisions, and FP&A modelling.
2. Seasonality
Seasonality in the purple line is an aspect of many time series and plays a critical role in interpreting fluctuations due to different time consumptions. This fact indicates a remarkable and specific period during which there is a strong deviation from the general Trend.
In the figure above, negative or positive values indicate sales below or above the Trend, respectively. Understanding and quantifying Seasonality enables more accurate forecasting and better strategic planning.
From an FP&A perspective, this insight helps teams phase budgets, align marketing campaigns, and forecast working capital needs with greater precision.
3. Remainder
The Remainder, or residual in green, is the third component in the Decomposition. It captures the portion of the time series that cannot be explained by either the Trend or Seasonality. Mathematically, it is defined as the difference between the Original Series and the sum of the Trend and Seasonal components:
Remainder = Original Series – (Trend + Seasonality).
This is the irregular part of the data, driven by random or unpredictable events.
Strategic Insights from Sales Data Decomposition: Foundations for Integrated Planning
1. The STL decomposition of YogoSmile’s sales provides some interesting clues about the market and the behaviour of the company. There are several important facts related to the various functions of the company. The Trend shows where the final pattern is going. It is extremely important for revenue, shareholders, and stability. It is the solid road on which the company can build its future for the coming years. It represents what management can rely on when defining future scenarios for growth. It is one of the analytical assets of YogoSmile, providing a basis for the decision-making process.
2. The Seasonal component is the primary key for all the departments. First of all, it drives production allocation. Peaks and troughs create different needs for resource allocation, as well as equipment and capacity planning. This also influences inventory control, where accurate calibration makes it possible to manage the situation more effectively.
It is also important to determine how to maximise or minimise the workload to meet high or low sales demand. Another impact is on financial accounts, where better cash flow can be guaranteed throughout the year. Indeed, effective financial planning can improve the DSO and DCO indexes based on seasonal patterns. The Financial Planning and Analysis department will therefore be able to assure better forecasting and cash flow planning according to these expectations. Finally, the marketing department benefits from noticeable improvements in campaign and promotional activities, focusing efforts on the stronger months of the year (March and September) and reducing activity during low-demand periods.
In short, STL provides the necessary tools for FP&A, Sales, Operations, and Marketing to speak the same language, enabling them to translate seasonal fluctuations into coordinated plans.
Summary Recommendation for Decomposition
The STL decomposition is a powerful tool for all functions: Production, FP&A, Marketing, Sales, Operations, and General Management. It provides a certain degree of flexibility by highlighting both the solid line representing the Trend and, at the same time, the fluctuations of Seasonality. A general discussion on how resources and capacity can be allocated in the short term is also a meaningful advantage for YogoSmile, anticipating risks and opportunities.
The next step will be to apply a forecasting method for sales, enabling the company to develop even more accurate and forward-looking strategies.
Forecasting
The first part, dedicated to Decomposition, has revealed some aspects of a Time Series where individual components are extracted to better understand which actions could be taken specifically. The next step is a broader view of forecasting, where YogoSmile can benefit from a one-year prediction horizon. In this case, the entire Time Series will be used.
There are many models and approaches available for forecasting. In this article, the model offering the best performance, as measured by the accuracy metrics, has been chosen.
Forecasting is often a very complex and detailed process, defined by different mathematical functions. In this case, after several attempts, a SARIMA model (Seasonal Autoregressive Integrated Moving Average) [Box et al., 2015] was selected.
The experimental design is based on a training phase using the monthly time series from 2015 to 2021. The objective is to build a model based on past years and generate a forecast for the following year, 2022, to assess the reliability and accuracy of the prediction.
In the two figures below, actual sales observations are shown by the blue line, while the forecast is represented by a red dashed line.
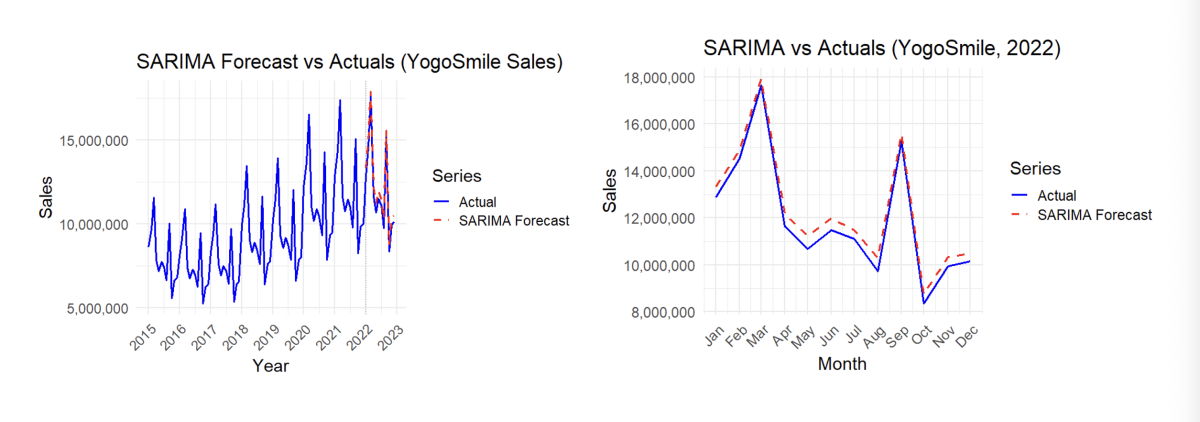
Figure 3. Forecasting YogoSmile Sales for Year 2022
The first plot shows the entire time series across all years, with the forecast highlighted for 2022. The second plot focuses specifically on the test phase, comparing actual and forecast values for 2022 only.
As shown in the plots above, the forecasting line with a 12-month horizon is very close to the observed values. It follows the peaks in March and September, when YogoSmile consumption is higher, and approaches the troughs, although it slightly overestimates the declines. This is particularly evident in the second part of the plot, which focuses solely on the prediction for the year 2022.
Several metrics measure the forecast accuracy, the most popular being MAPE (Mean Absolute Percentage Error) and MAE (Mean Absolute Error). Both express the goodness of fit between forecasted figures and actual data, allowing for a quick evaluation of how closely the forecast line aligns with the observed values. The lower these indexes, the better the performance.
For YogoSmile, the MAPE is 3.70% and the MAE is 416,956 units. These very low errors indicate an excellent level of prediction accuracy. In particular, MAPE is suitable for strategic planning and can guide general management in improving resource allocation.
MAE, on the other hand, is more relevant for inventory management and for assessing potential increases or decreases in future consumption. Peaks in March and September and falls in May and October, remain part of the business’s natural cycle and represent an important signal for buyers, production, and especially the FP&A team to plan future budgets more effectively. The forecasting process can also be repeated each month after consolidation, allowing for recalibration of the rest of the year with a progressively shorter forecasting horizon.
Together, these metrics demonstrate that the SARIMA model provides highly reliable forecasts for YogoSmile's sales, with only minor deviations from the actual monthly figures.
In FP&A activities, this means reducing uncertainty, improving buffer management, and making more proactive decision-making across the financial year.
Conclusion
In summary, two different approaches have been explored here for analysing and forecasting the YogoSmile sales time series. The decomposition method allows a separation between Trend and Seasonality, highlighting the behaviour of these two components, which are normally hidden within the overall pattern of the sales series.
STL is a robust method, where the components are part of the business cycle and where the different functions, at different levels, are involved in optimising the entire process.
On the other hand, the projection model SARIMA offered a direct forecasting solution. Its out-of-sample accuracy metrics, measured by MAPE and MAE, demonstrated high accuracy and reliability, making the planning of future periods easier to interpret and manage.
Overall, the methods presented above support a better interpretation and understanding of the business cycle. Trends, seasonal fluctuations, and periods of high and low demand for yoghurt can be more effectively managed through these preliminary assumptions about the nature of the business. Greater calibration and control can, in turn, strengthen YogoSmile’s position in the market.
Takeaway for FP&A:
Better forecasts mean higher accuracy, more agile inventories, and smarter cash planning — turning data into tangible business impact.
References
- Cleveland, R.B., Cleveland, W.S., McRae, J.E., & Terpenning, I. (1990). STL: A Seasonal-Trend Decomposition Procedure Based on Loess. Journal of Official Statistics, 6(1), 3–73.
- Box, G.E.P., Jenkins, G.M., Reinsel, G.C., & Ljung, G.M. (2015). Time Series Analysis: Forecasting and Control (5th ed.). John Wiley & Sons.
The full text is available for registered users. Please register to view the rest of the article.
Related articles

In this article, the author explains how integrated modelling enables FP&A leaders to balance speed and...

In this article, explore how FP&A teams are using AI-powered forecasting models like Prophet and XGBoost...

Confusing forecasting with target setting derails accountability and performance — FP&A must treat them as distinct...

In this article, the author reveals four forecasting hacks that can help us enhance business value...

In the second part of this series, the author discusses three components that rely heavily on...
+
Subscribe to
FP&A Trends Digest
We will regularly update you on the latest trends and developments in FP&A. Take the opportunity to have articles written by finance thought leaders delivered directly to your inbox; watch compelling webinars; connect with like-minded professionals; and become a part of our global community.